Viewing your applicationTime Travel DebuggingJumping to an event handlerJumping to a console logEvaluating print statementsJumping to a network requestJumping to a breakpointJumping to a Redux actionInspecting and EvaluatingInspecting elementsInspecting React componentsInspecting function and code line executionInspecting the Call Stack and ScopesEvaluating in the ConsoleWhat’s next
Viewing your application
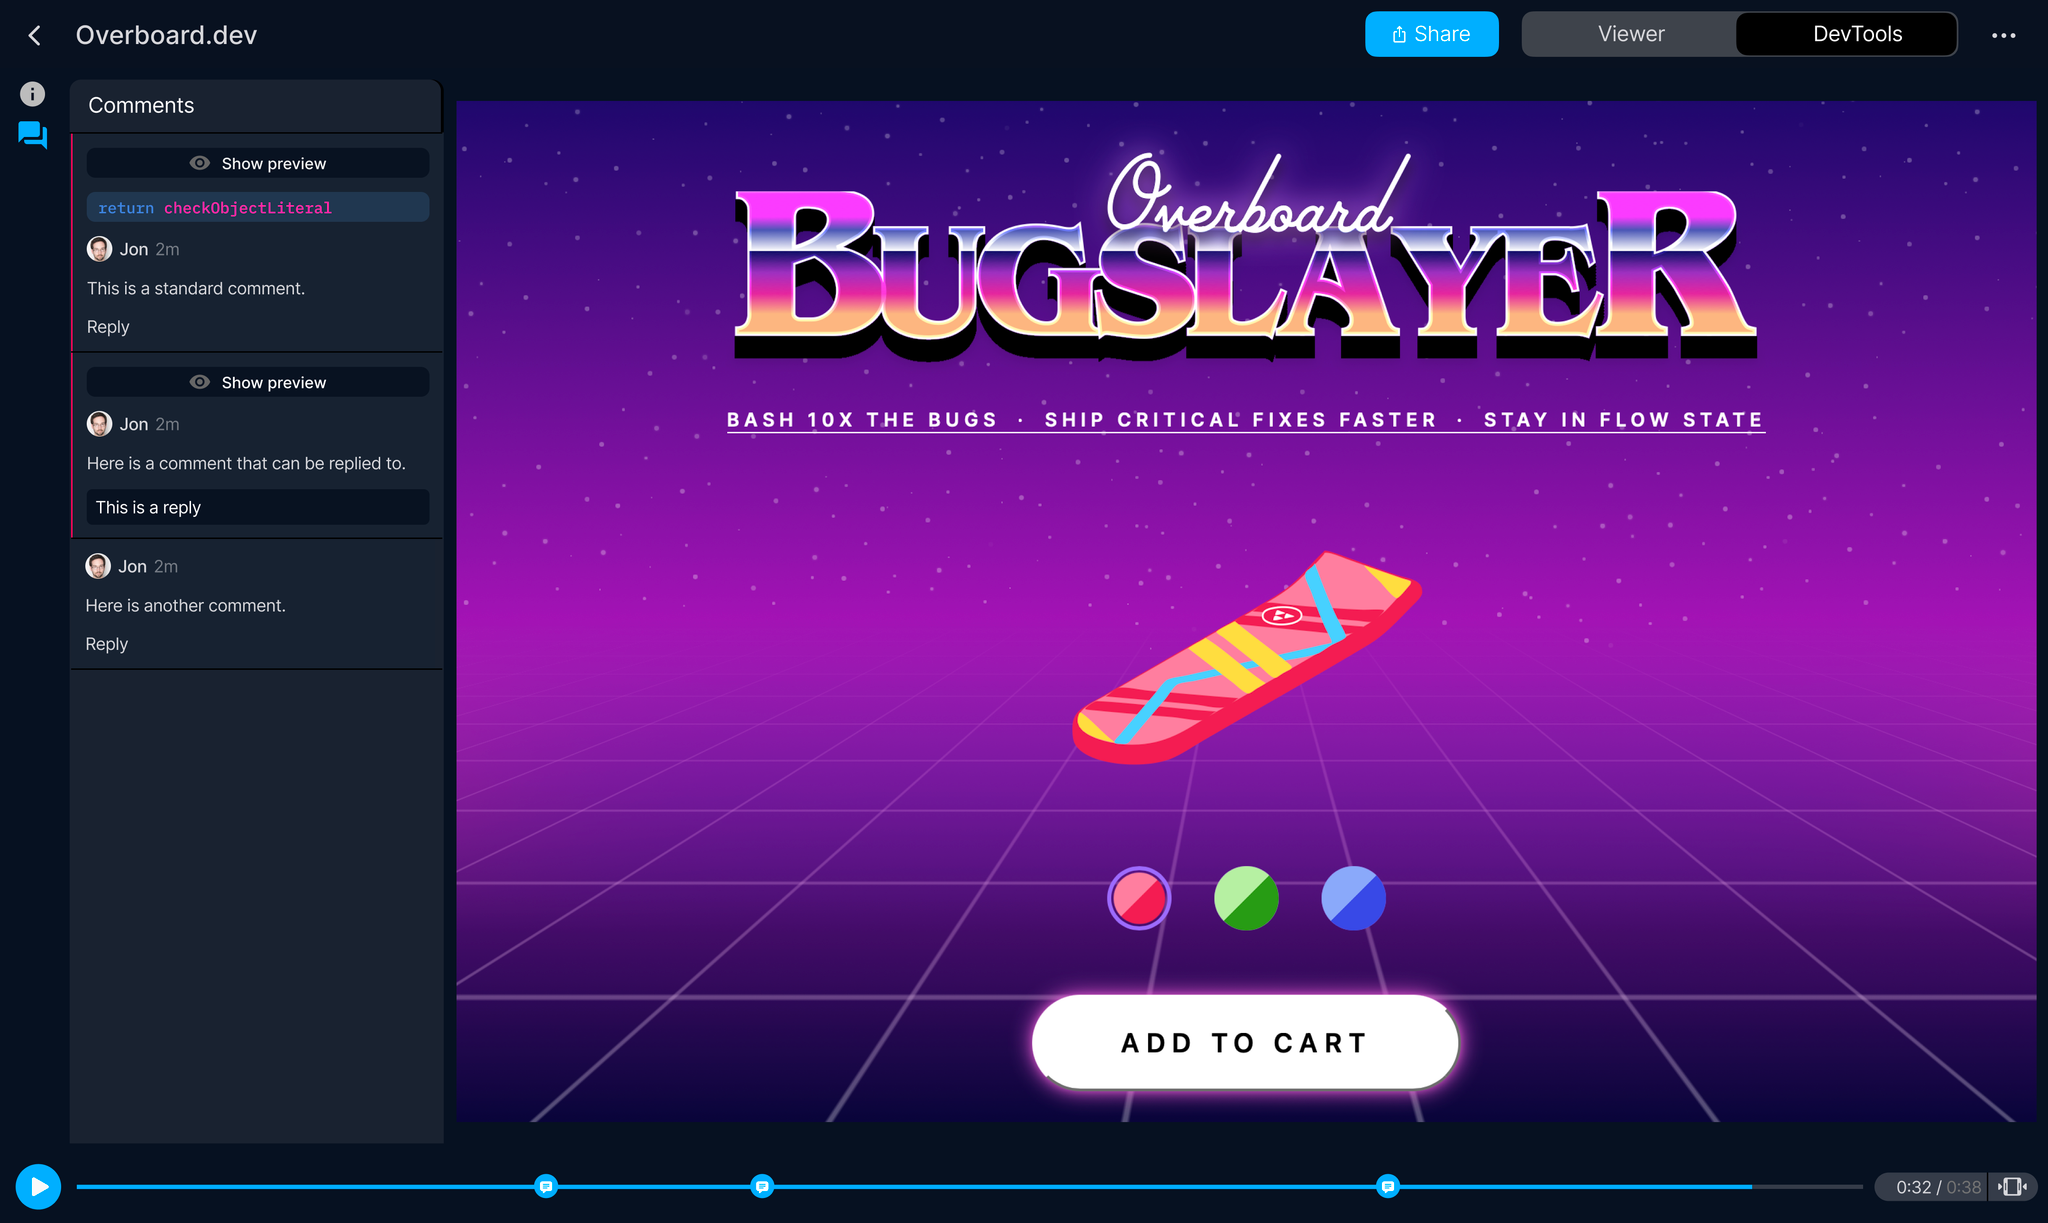
It’s important to get a sense of what was happening in the app at the time of the issue. With the Viewer, you can playback the user session, view user events in the timeline, and add comments in the video.

Time Travel Debugging
When you switch to DevTools, you’ll see everything you’d find in Chrome Devtools except now they’ve been super charged with time travel. For the first time you’re able to jump from a user event to where the event was handled and from a log in the Console to where the log was emitted. For the first time, you can start time traveling!
Jumping to an event handler
It can be helpful to jump directly to the line of code that causes an event. In the events pane, click the blue button to have that line of code open in the source viewer.
Jumping to a console log
You can jump between console messages generated from your application, or ones you’ve added with Replay’s print statements feature.
Evaluating print statements
Replay lets you add print statements (also called console logs) to an existing replay with no need to compile or re-run the code. Adding print statements to a replay is like going back in time and adding markers to your code to broadcast information at specific points.
Let’s say you have a click handler that is supposed to update the value of a variable, but you’re not sure if it’s actually working. You could add a print statement to log the value of that variable after the function executes to see if it actually updated.
With Replay print statements, you can see how many times a function executed, evaluate parameters, and even add comments to provide insights for your team.
Jumping to a network request
The Replay Network Monitor is helpful for debugging anything related to your API or any external network requests going in and out of your application.
If requests fail or time out or if data coming from your back end isn’t accurate, the Network Monitor can help identify problematic requests for debugging. All network requests appear as a timeline so you can navigate back and forth between calls.
Jumping to a breakpoint
Breakpoints are the remote control for your code — pause, rewind, fast-forward, and step through your code line by line to evaluate it at various points in time. This can be particularly helpful when you have granular timing or async code issues causing a bug.
Jumping to a Redux action
The experimental Redux DevTools integration will show dispatched actions up to the point in time you are paused in the replay. We are building out functionality to add a timeline view, stack traces, and more.
Inspecting and Evaluating
Once you’ve narrowed in on the points in time to debug, Replay provides all the tools you need to inspect and evaluate your application.
Inspecting elements
The Elements panel is the blueprint of the HTML elements and CSS styles for your app. If you have issues with how your app is being displayed, this is a great place to start. View the structure of your HTML elements and see what styles have been applied. You can also see which elements have event listeners.
Inspecting React components
For React applications, you can view components, props, state, and hooks with Replay’s React DevTools.
React DevTools helps you answer questions like
- Was the correct prop passed to a component?
- Did a hook fire at the correct time with the correct value?
- Are there competing sources of truth for state management?
- Is my component tree rendered as expected?
Inspecting function and code line execution
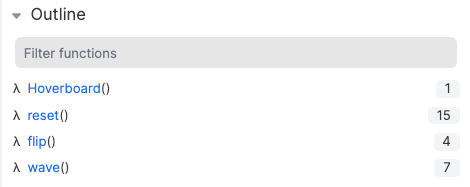
How confident are you in the actual execution of your code? Bugs often occur when the reality of our app execution does not match our expectations. With Replay, the Function Outline shows all the functions in the source and how many times each function was executed.

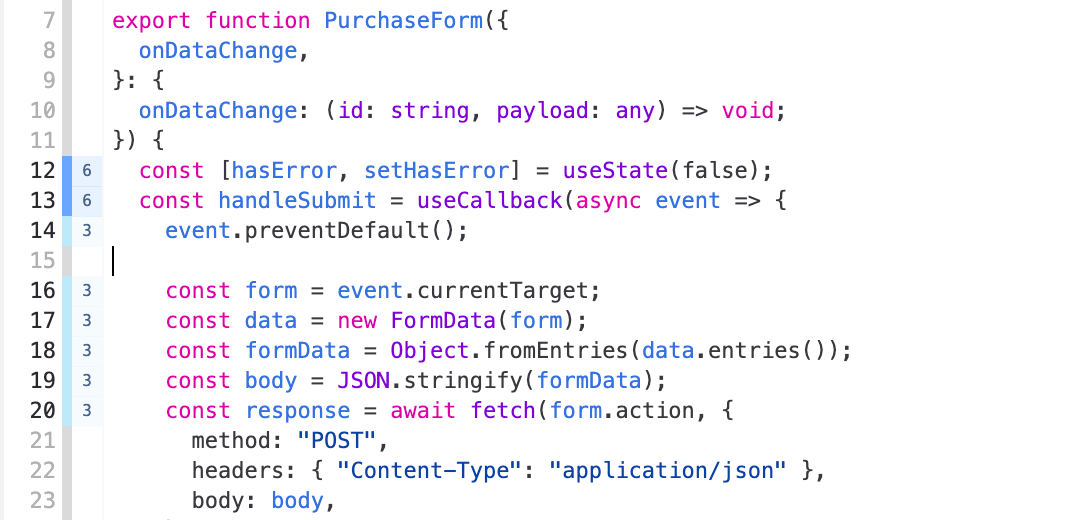
The Heat Map in the editor’s gutter is helpful for seeing how many times a line was executed. This helps to identify dead code that never ran, or lines that are running too frequently and may be causing performance issues.

Inspecting the Call Stack and Scopes
When paused on a specific execution of a line of code, you can view the call stack leading up to that point.
The Scopes pane will show the values of properties and variables within a given scope when paused on an execution of a line of code.
Evaluating in the Console
The Console lets you view and navigate between print statements and events that occur in your application. You can also use the console to evaluate expressions in order to see the value of variables at different points in time.
Check out our Console documentation for more.
What’s next
Replay works best when used by a team. Teams lets you easily collaborate and gives access to features like source map uploads, recording automated tests, and managing access to team replays. Learn more in Setting up a team.
