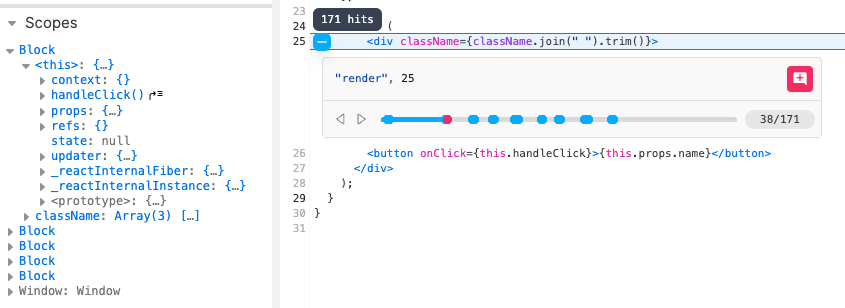
Breakpoints in Replay work like breakpoints in other debugging tools, but with some extra insights and usability features.
With Replay you can easily navigate between breakpoints, track and update all breakpoints in your code, and view helpful details like the call stack and scopes for each line. You can also step through your code and see the replay video and console change to represent your application at that moment in time.
Adding a breakpoint
Clicking in the gutter to add and remove breakpoints. All existing breakpoints are listed in the Breakpoints pane in the Pause Information panel.
Adding a breakpoint automatically opens the panel, or click the pause icon in the left sidebar to toggle the view.
You can also click the x icon on any existing breakpoint in the Breakpoints pane to remove it.
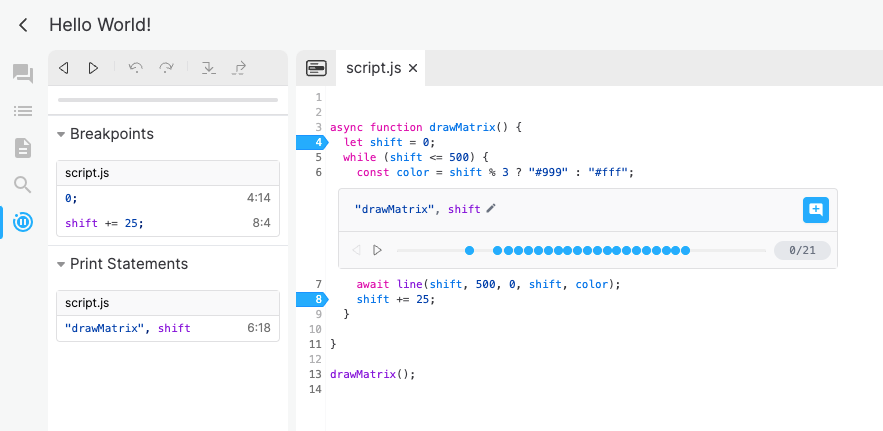
Navigating between breakpoints
Click resume and rewind in the Pause Information panel to go to the next or previous breakpoint.
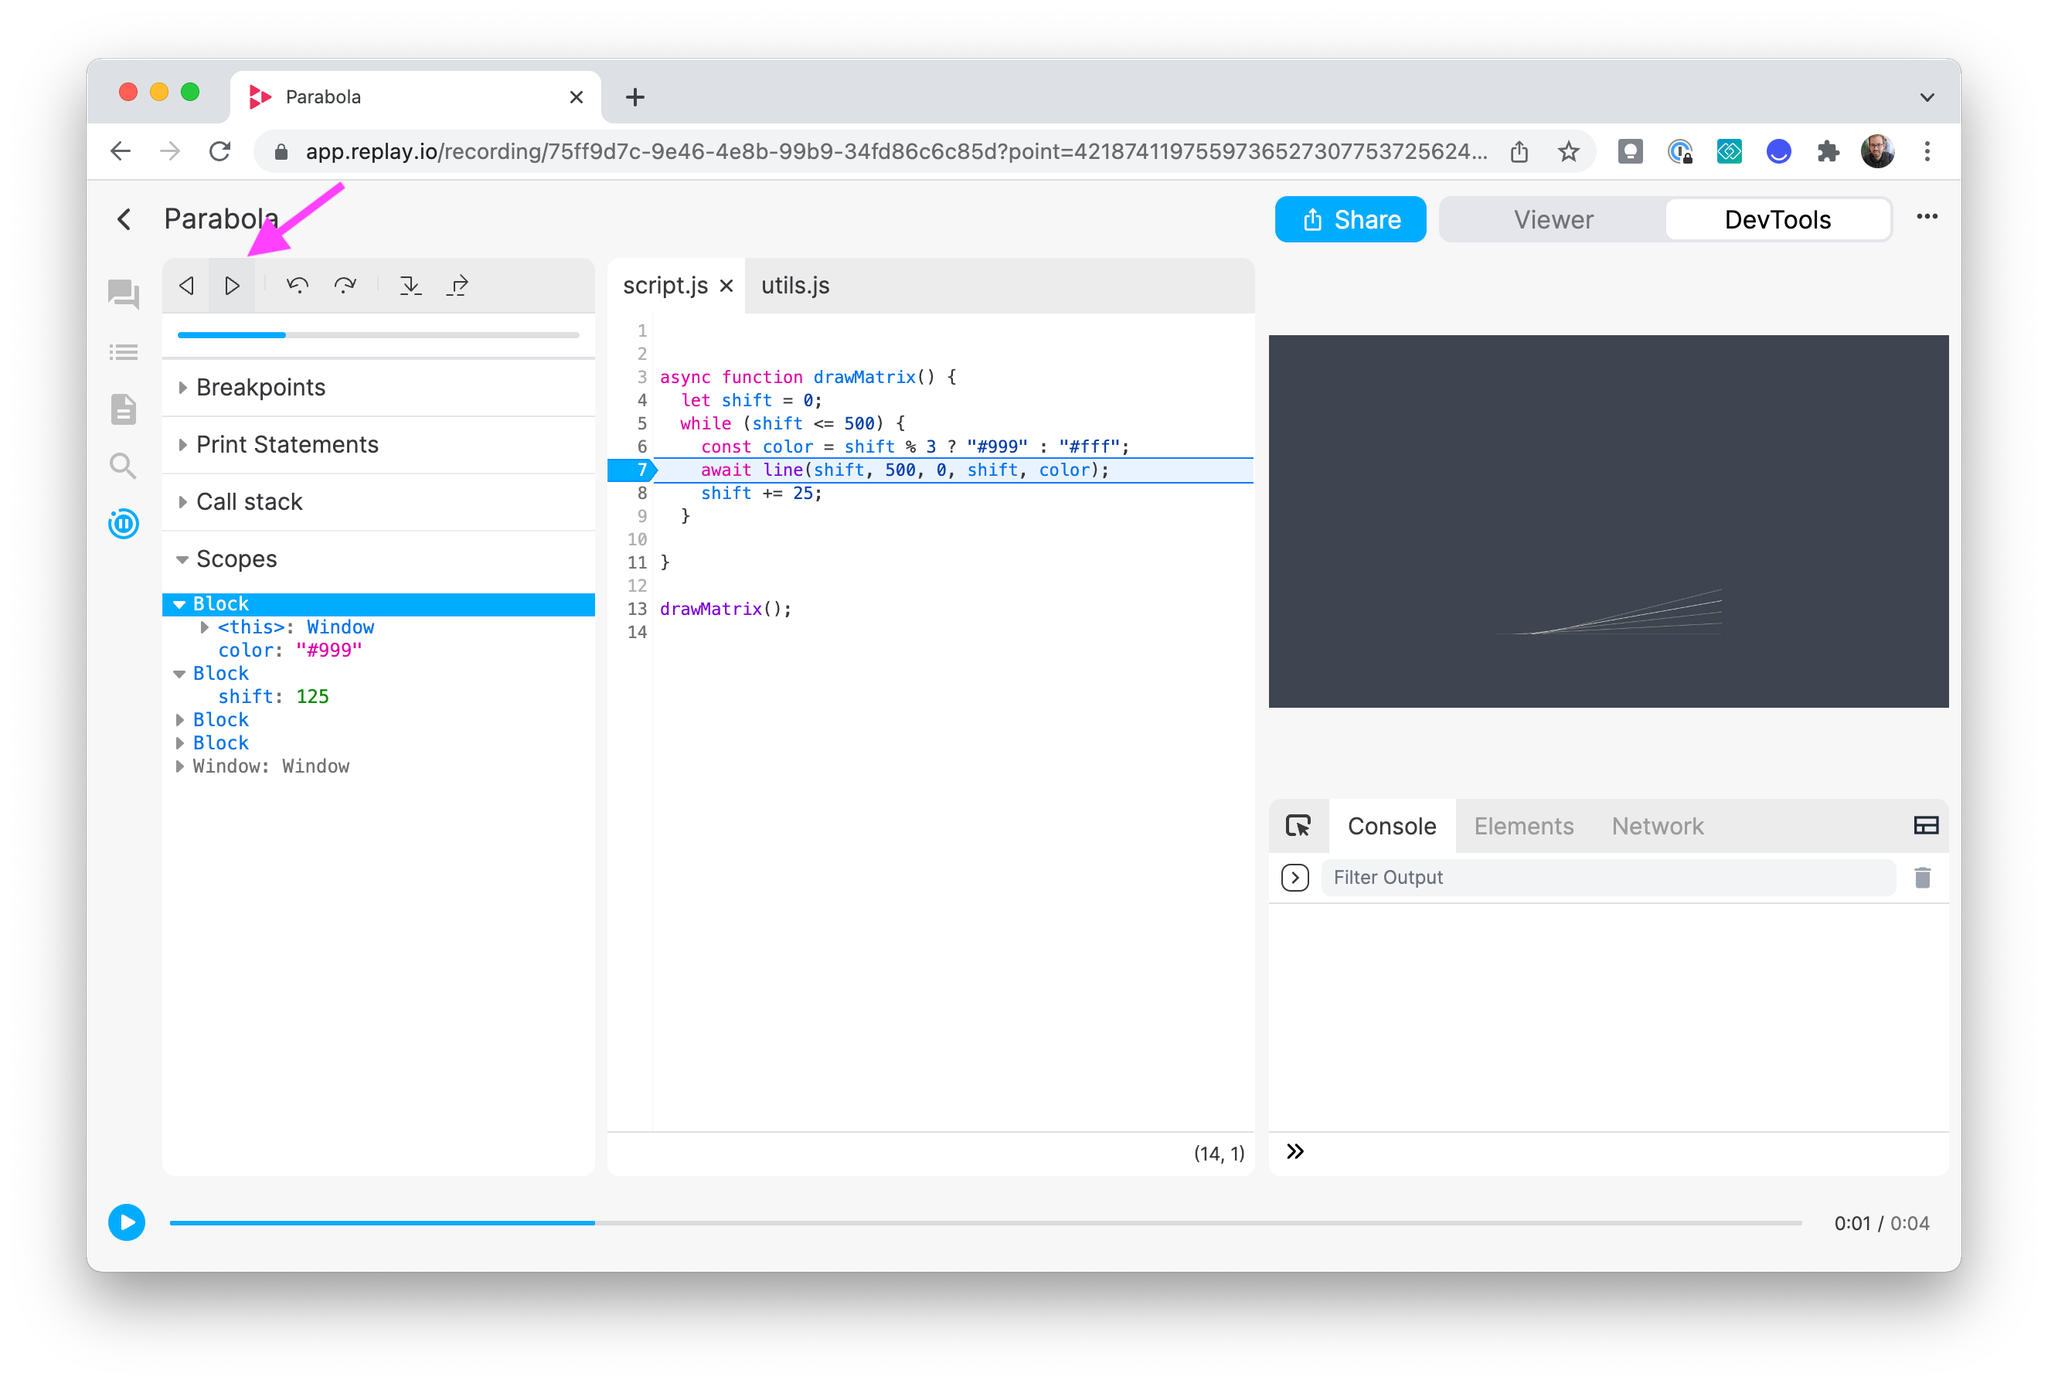
Stepping forward and backwards
Click step forward or backwards to go to the next or previous expression.
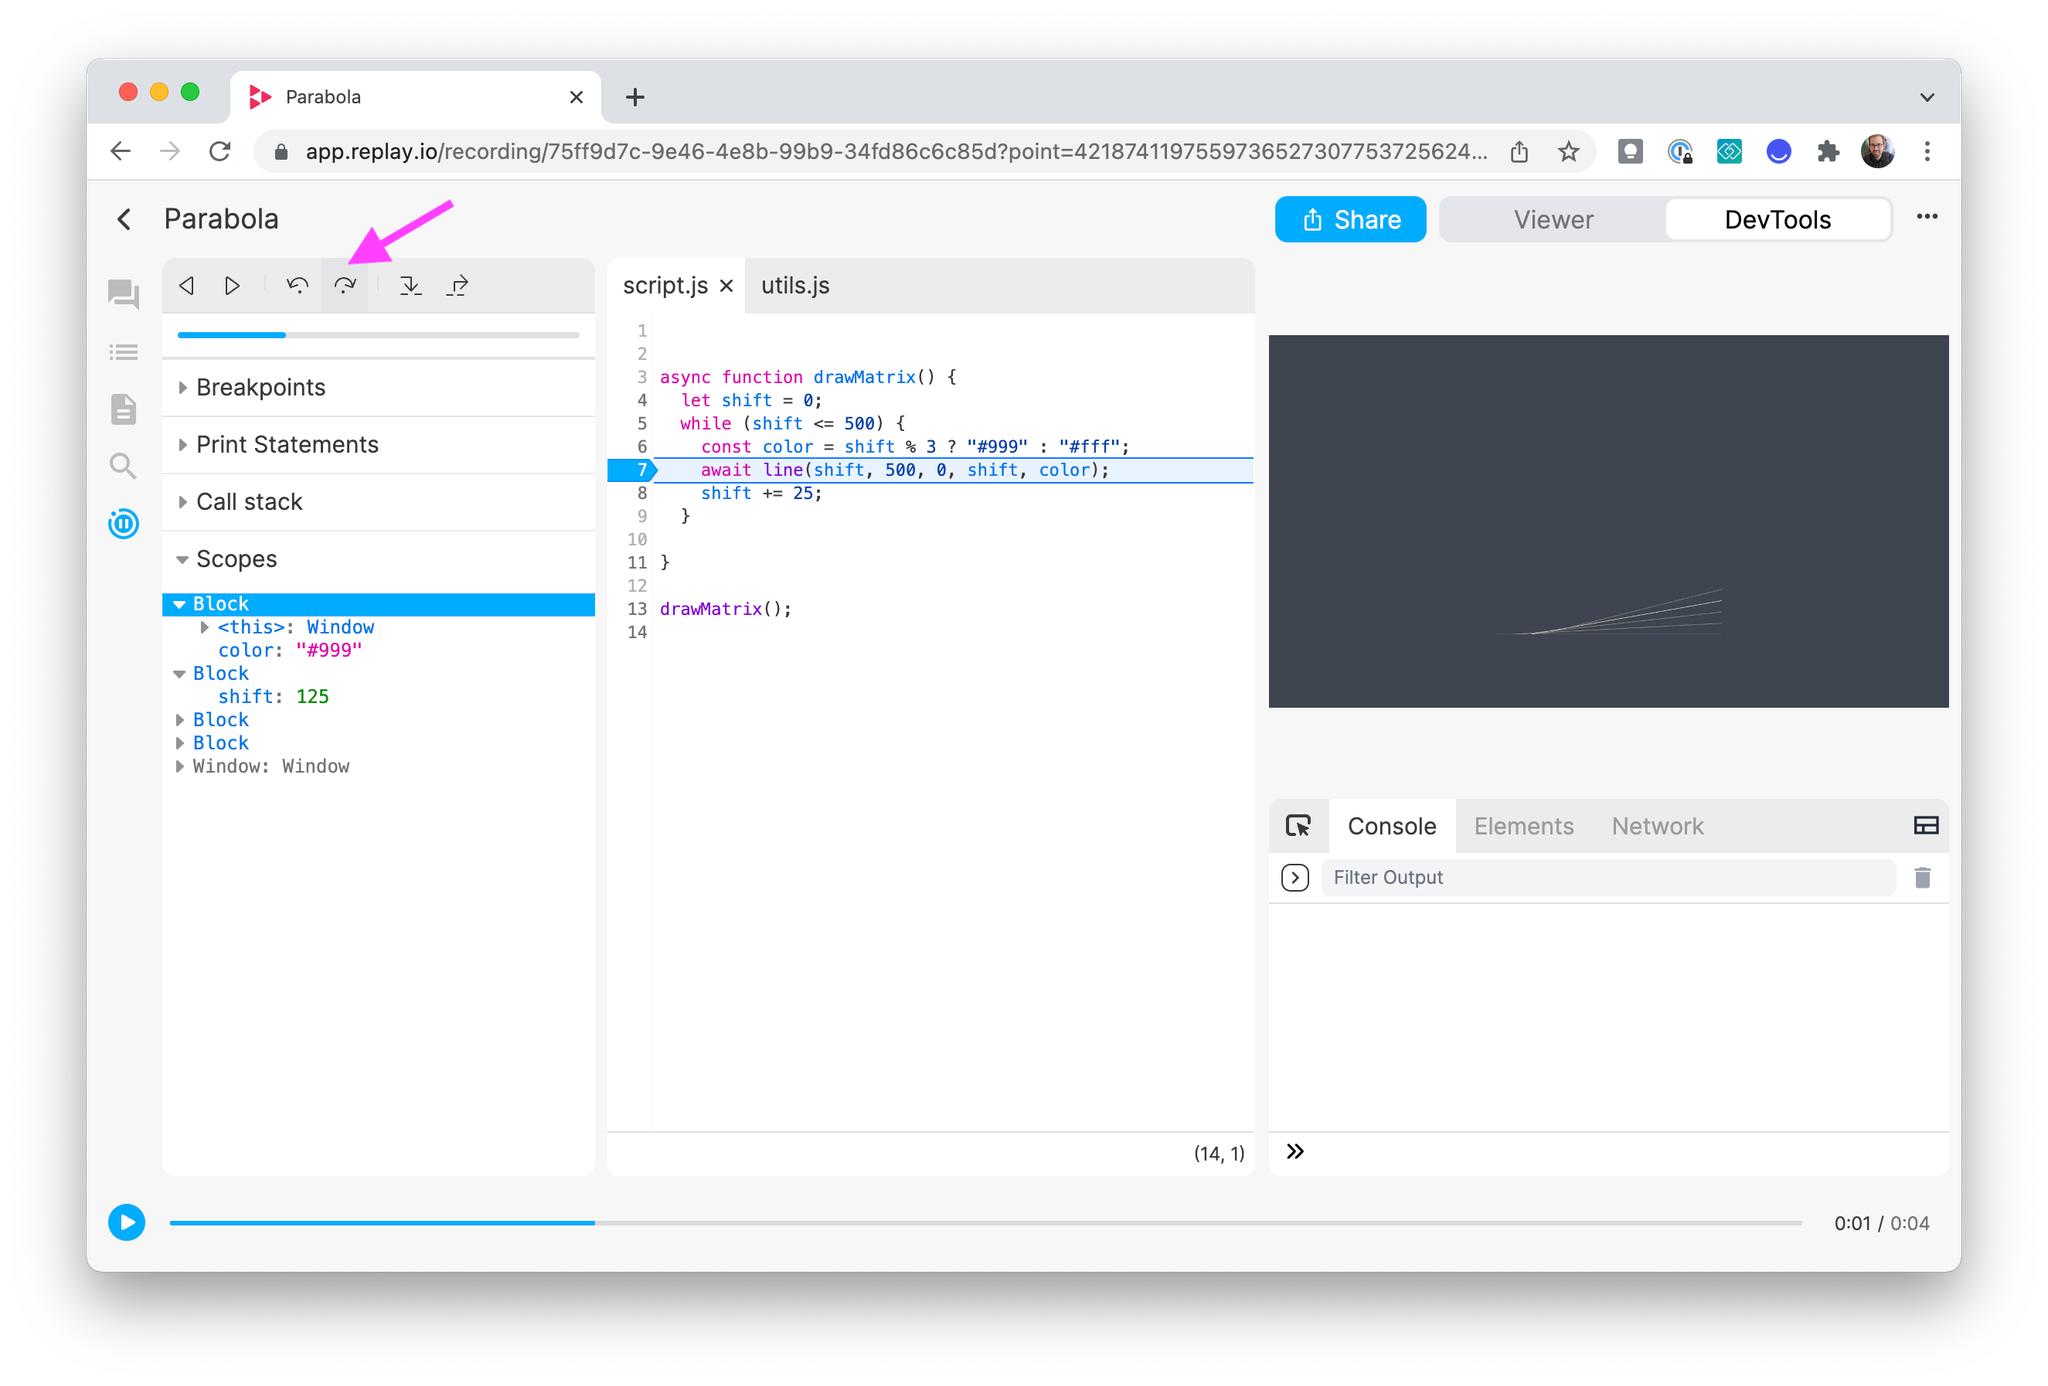
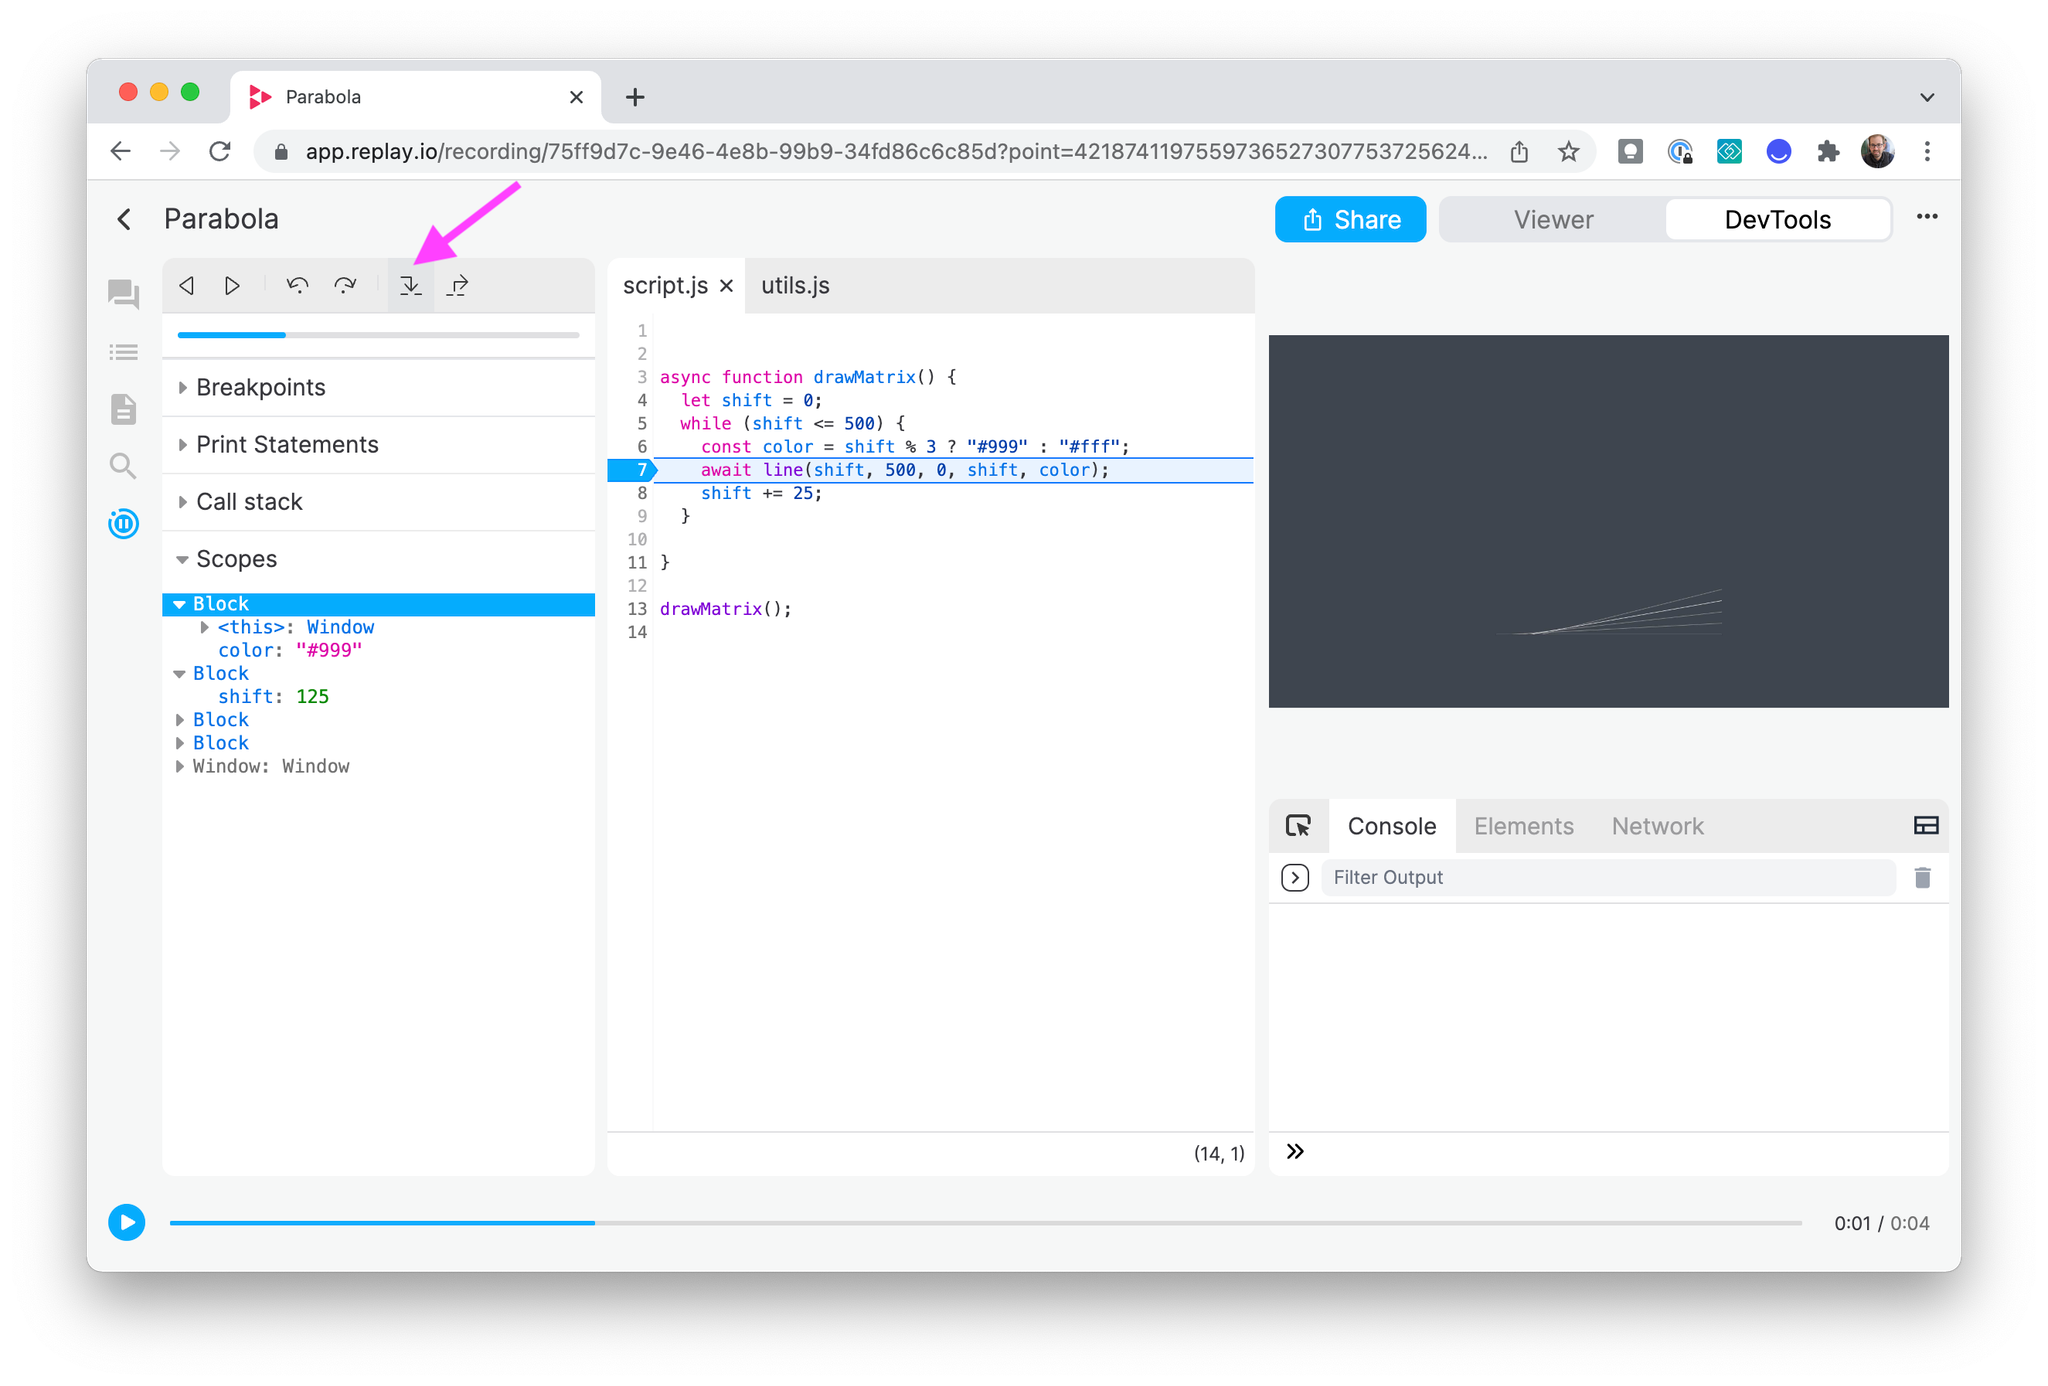
Stepping in
Click step in to enter the next function call or advance to the next expression.
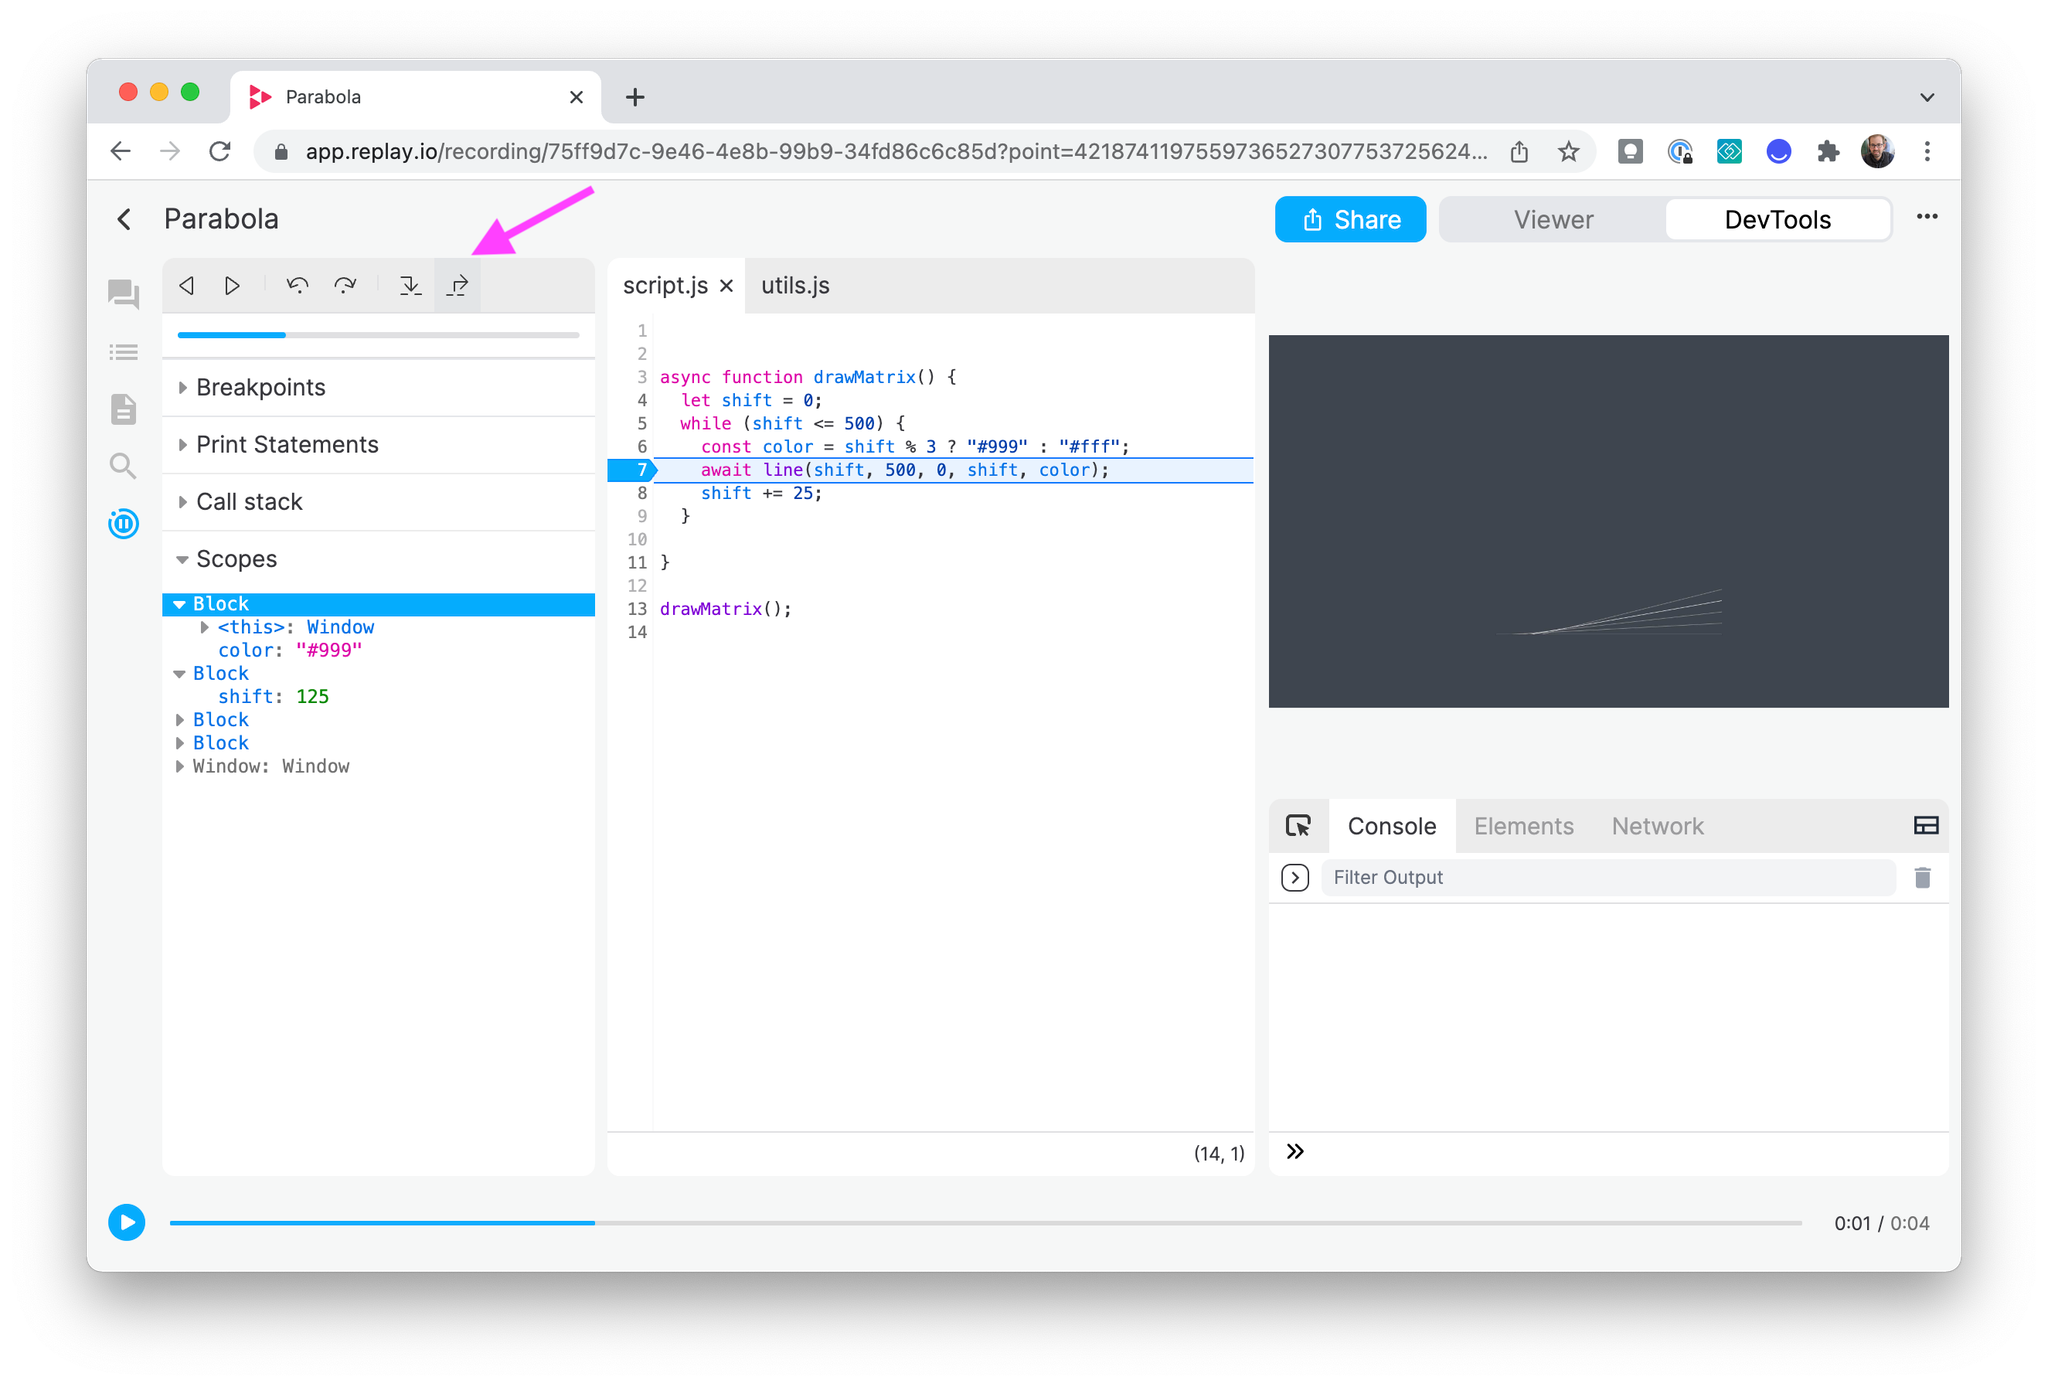
Stepping out
Click step out to exit the current function.
Scrubbing forward and backwards
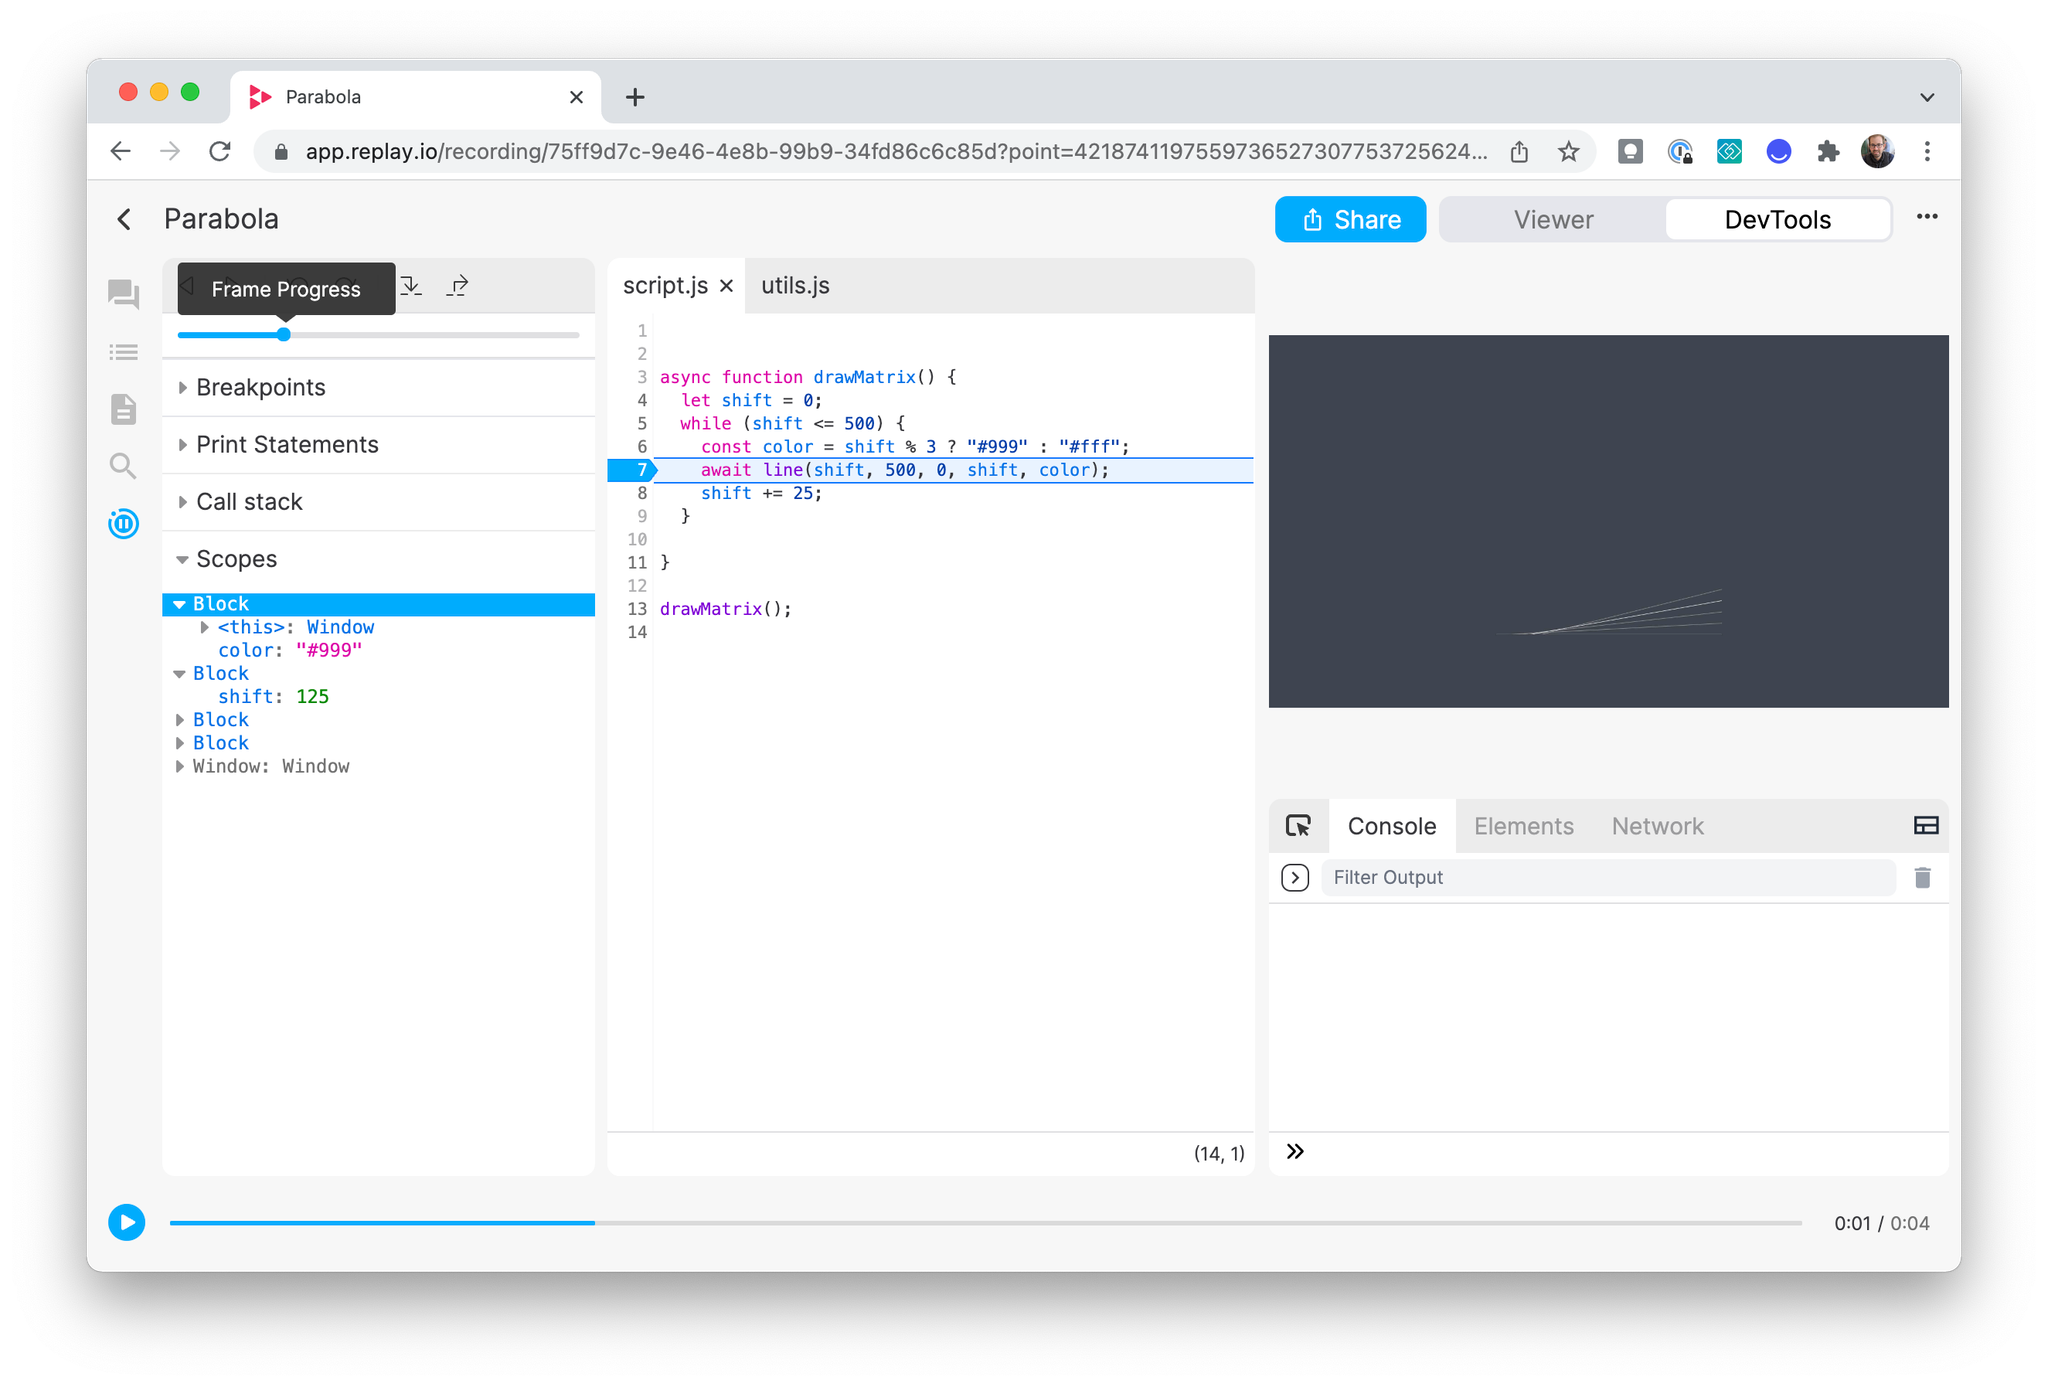
Scrub forward or backwards in the frame timeline to move forward or backwards in the current function. Click and hold the blue marker while dragging along the timeline to scrub. You’ll see the highlighted line of code in the Editor change as you move.
Navigation Shortcuts
Jump to the next or previous execution of a given line with navigation shortcuts.
When hovering on a line in a source:
- Press and hold
cmdto transform the+button to>. Click to navigate to the next hit of the line from your current location in time.
- Press and hold
cmd+shiftto transform the+button to<. Click to navigate to the previous hit of the line from your current location in time.
You will see dots appear on the timeline that mark the executions of that line. The dots will turn red as you navigate between points.
Call Stack
When paused on a specific execution of a line of code, you can view the call stack leading up to that point. The call stack shows which function calls resulted in the specific line of code executing.

The Call Stack will also show function executions in the stack related to React and Redux.
Scopes
The Scopes pane will show the values of properties and variables within a given scope when paused on an execution of a line of code. View values within the context of local, closure, and global scopes.
