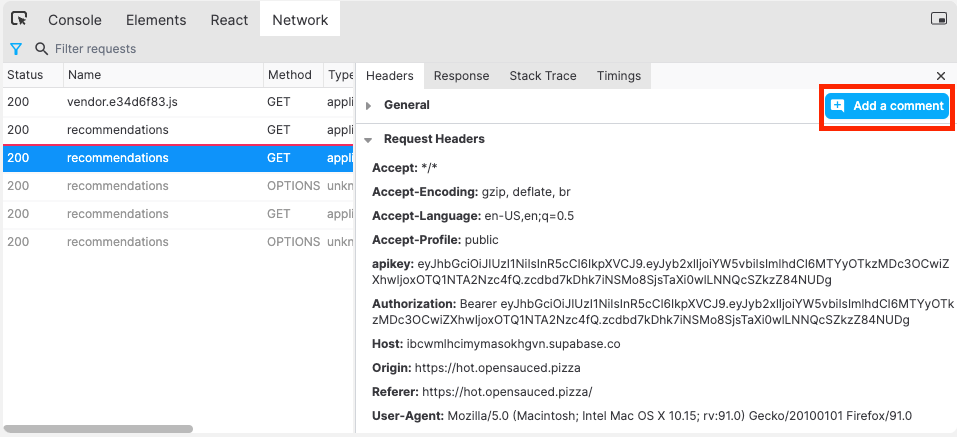
The Network Monitor gives you insight to the network activity taking place during your replay. Understanding the requests and responses interacting with your application is helpful for identifying a variety of common issues, including:
- Failed network requests
- Incorrect or unexpected requests
- Incorrect or unexpected responses
- Requests executing too early or too late
- Improper handling of async network activity
Replay’s Network Monitor lets you view resource details, request and response bodies, and even request stack traces.
Viewing network activity
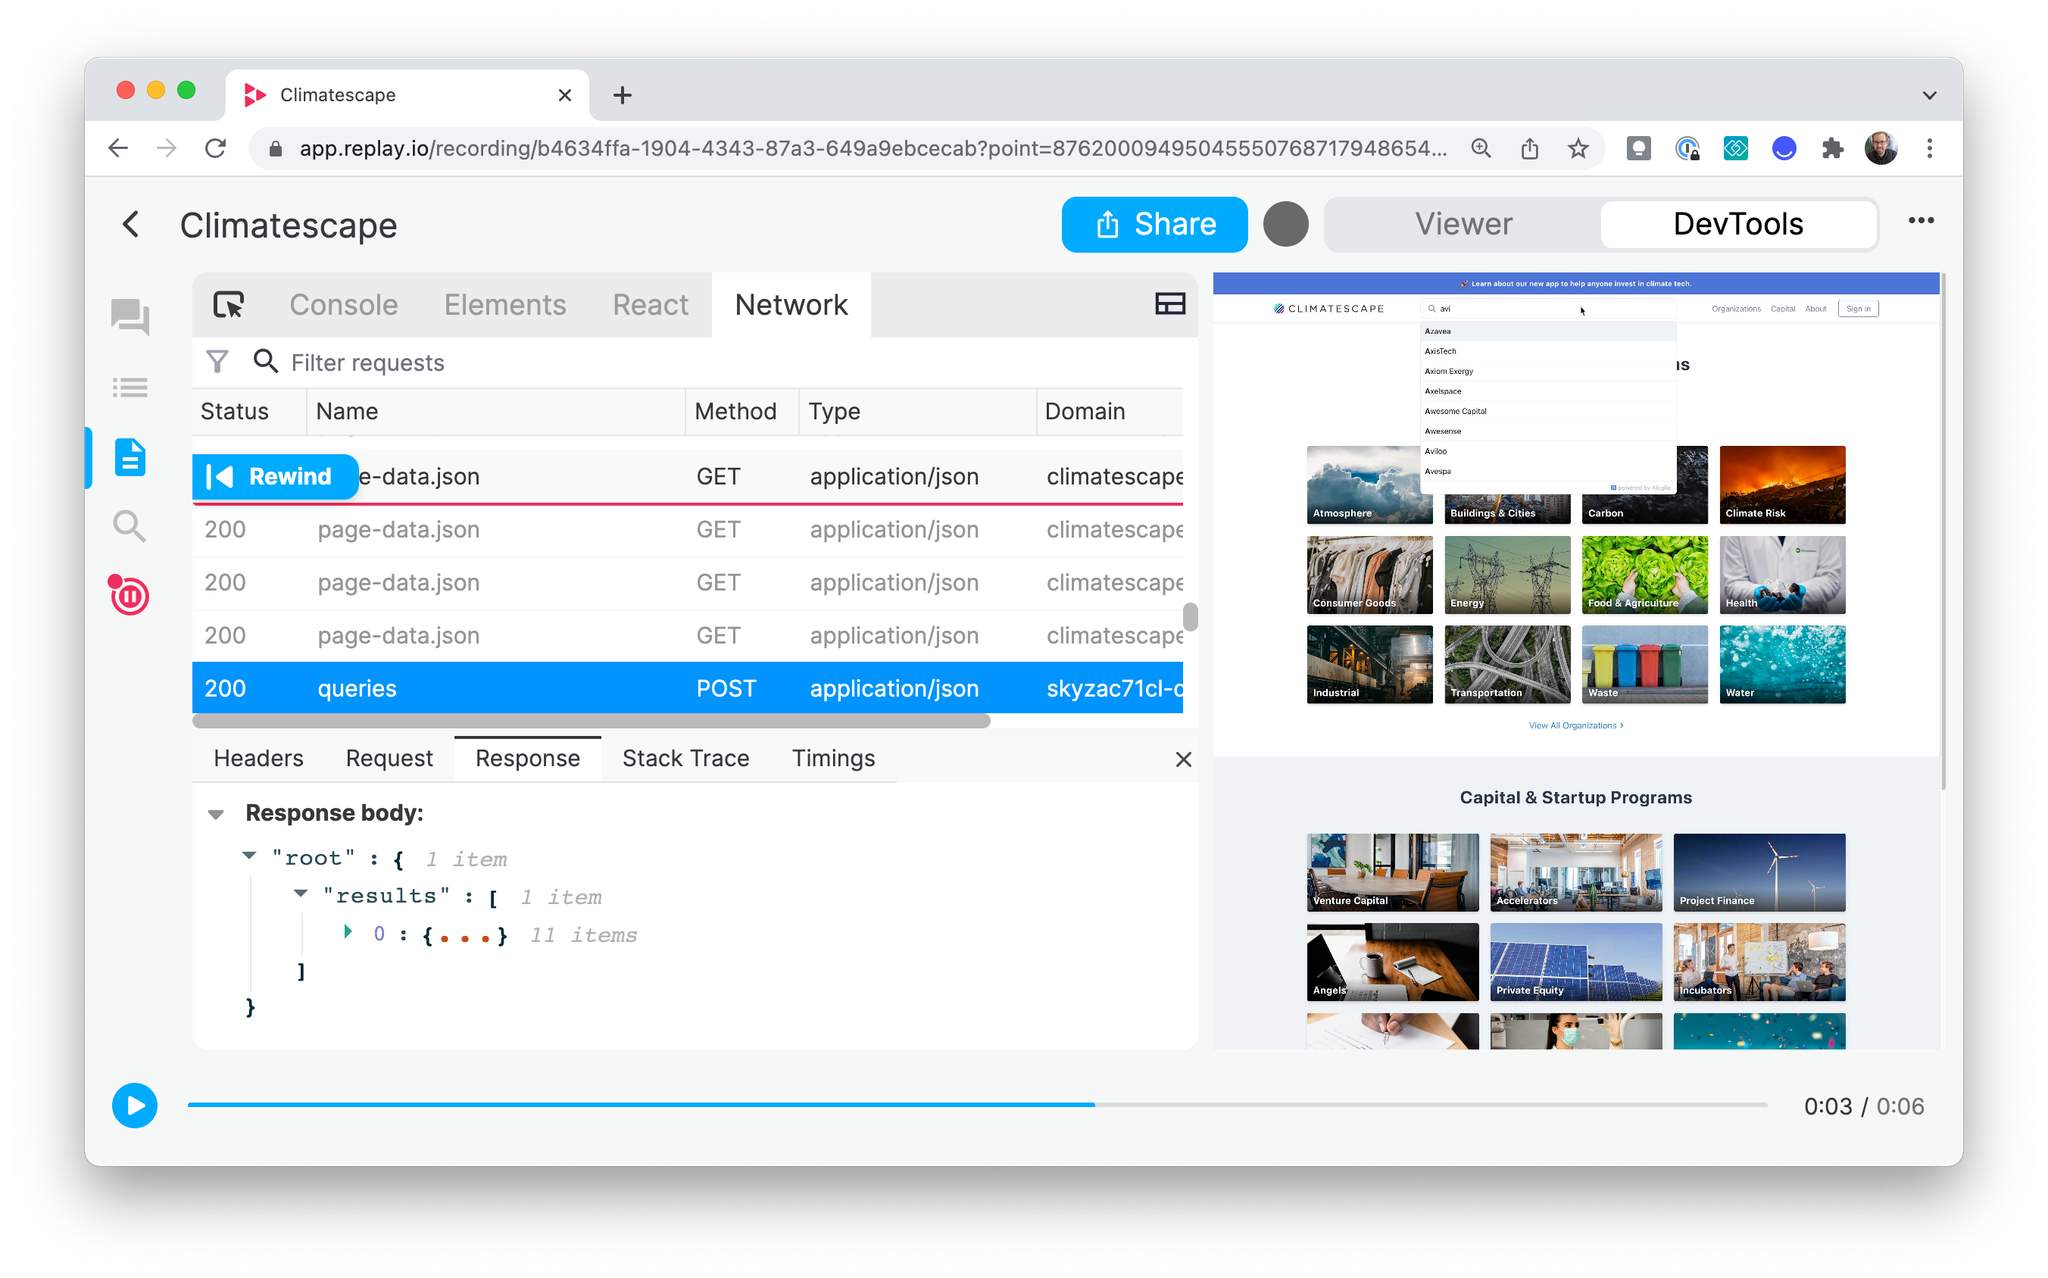
View network activity by selecting the Network tab in the Console panel.
The Network table shows resources broken down by type in the following order:
- CSS
- Fetch/XHR
- Font
- HTML
- Image
- JavaScript
- Manifest
- Media
- WASM
- Websocket
- Other
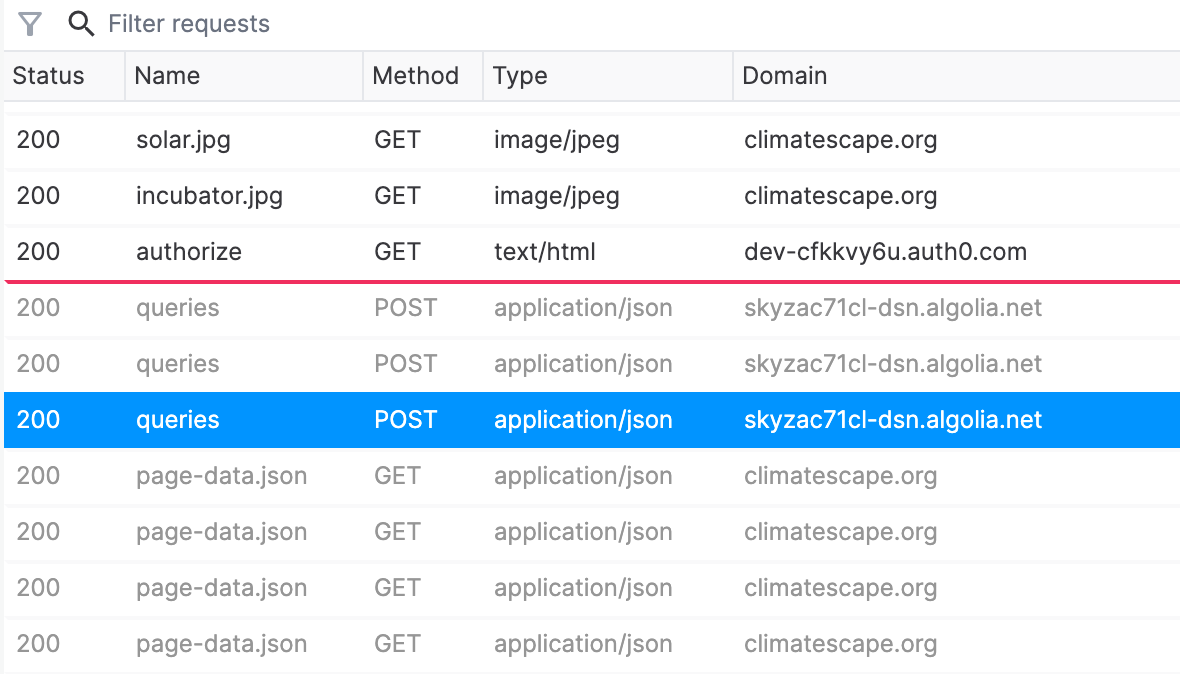
The table shows the resource response status, name, method, type, and domain. Like in the console, a red line indicates the current point in time when paused in a replay. All network requests after the current point in time are dimmed to indicate they have not yet occurred.
Why can’t I time travel to this request?
In order to support time travel the request has to be associated with a particular point in the browser’s JS execution timeline. Some requests, like those dispatched by HTML documents, are not associated with any particular JS execution point, even though they may have a “timestamp” associated with them. In those cases, you won’t see a fast-forward or rewind button.
Unloaded network requests
When a replay is initially loading or a part of it has been unloaded, some network request details may not be available. These are dimmed and will not be clickable during this loading state. You can still fast-forward and rewind to these requests, but will not be able to view headers, or request/response bodies until that section of the recording is loaded (or re-loaded in the case of an unloaded section).
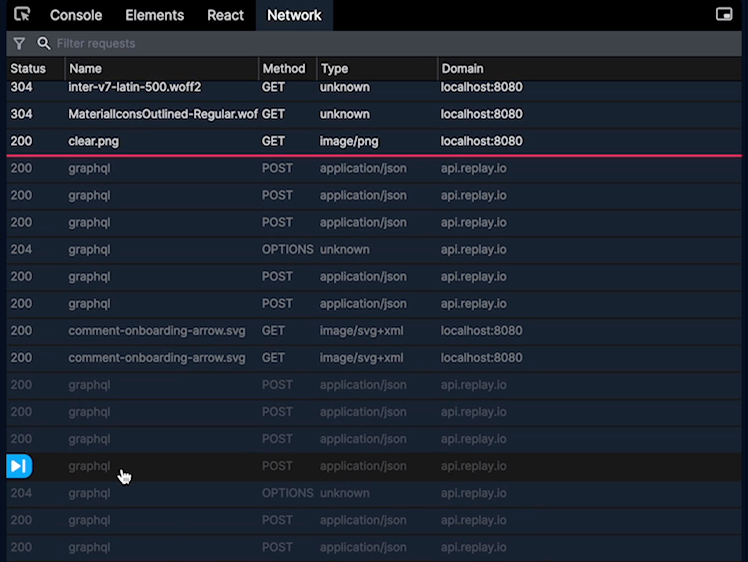
In the graphic above, the middle section of requests is slightly dimmed, because those requests happened later in the recording than the “present” (the red bar). The bottom section of requests also happened later, but they are in a section of the recording which is not currently loaded.
Inspecting a resource's details
Click on a resource in the table to inspect the resource details.
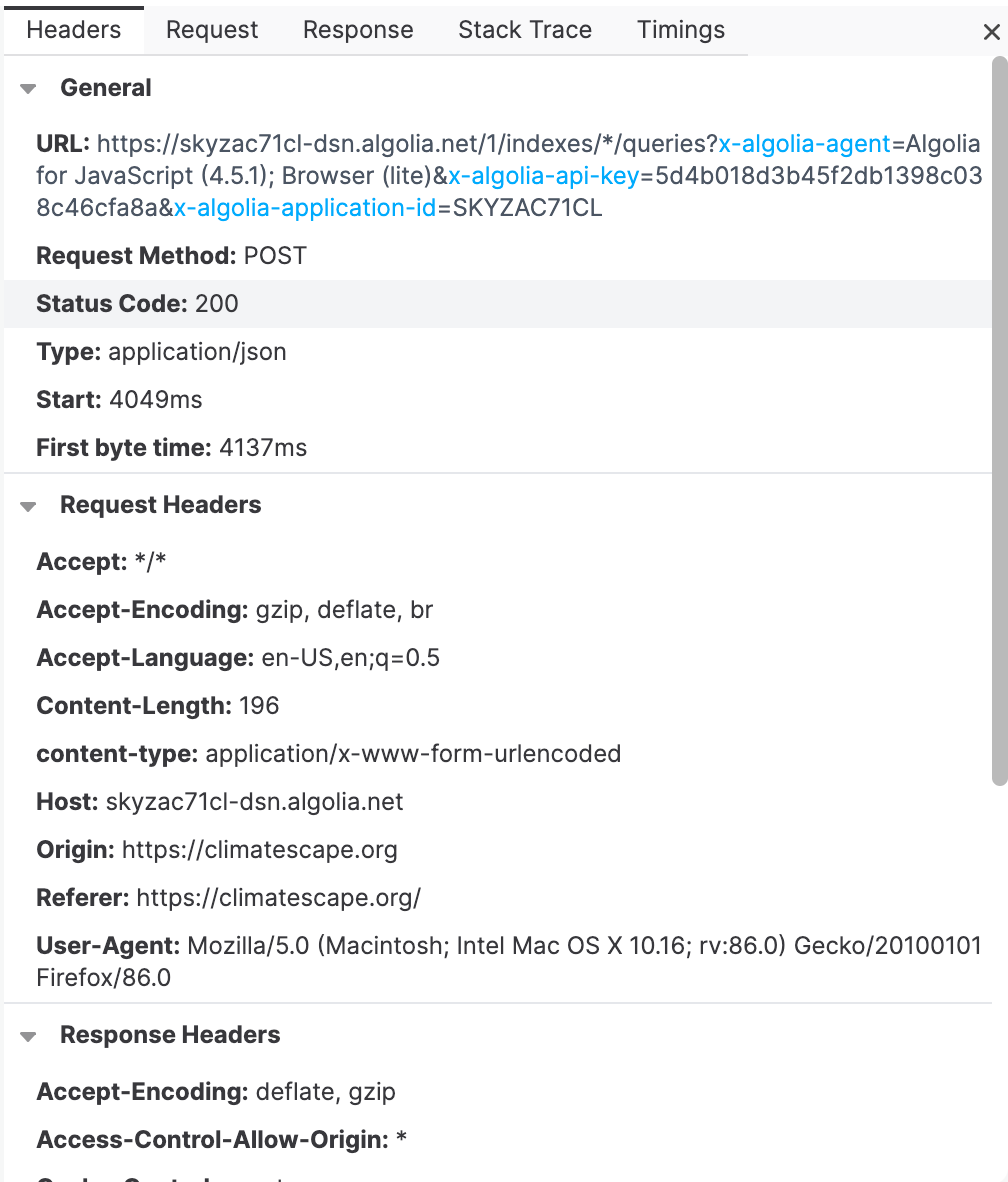
Resource details are broken down by section:
- General
- Request Headers
- Response Headers
Inspecting request bodies
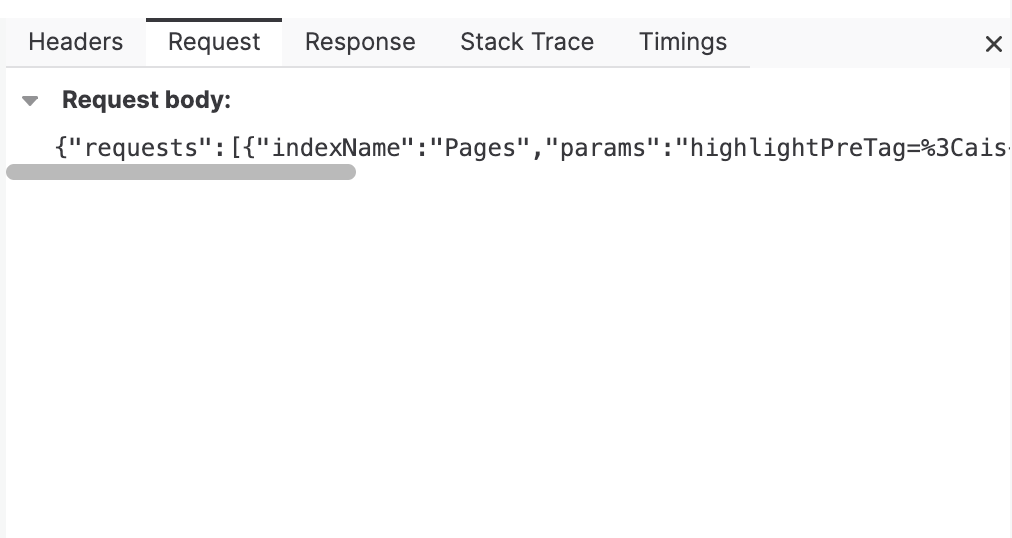
The Request tab shows the request body. The tab will not appear if there is no request body for the resource.
Inspecting response bodies
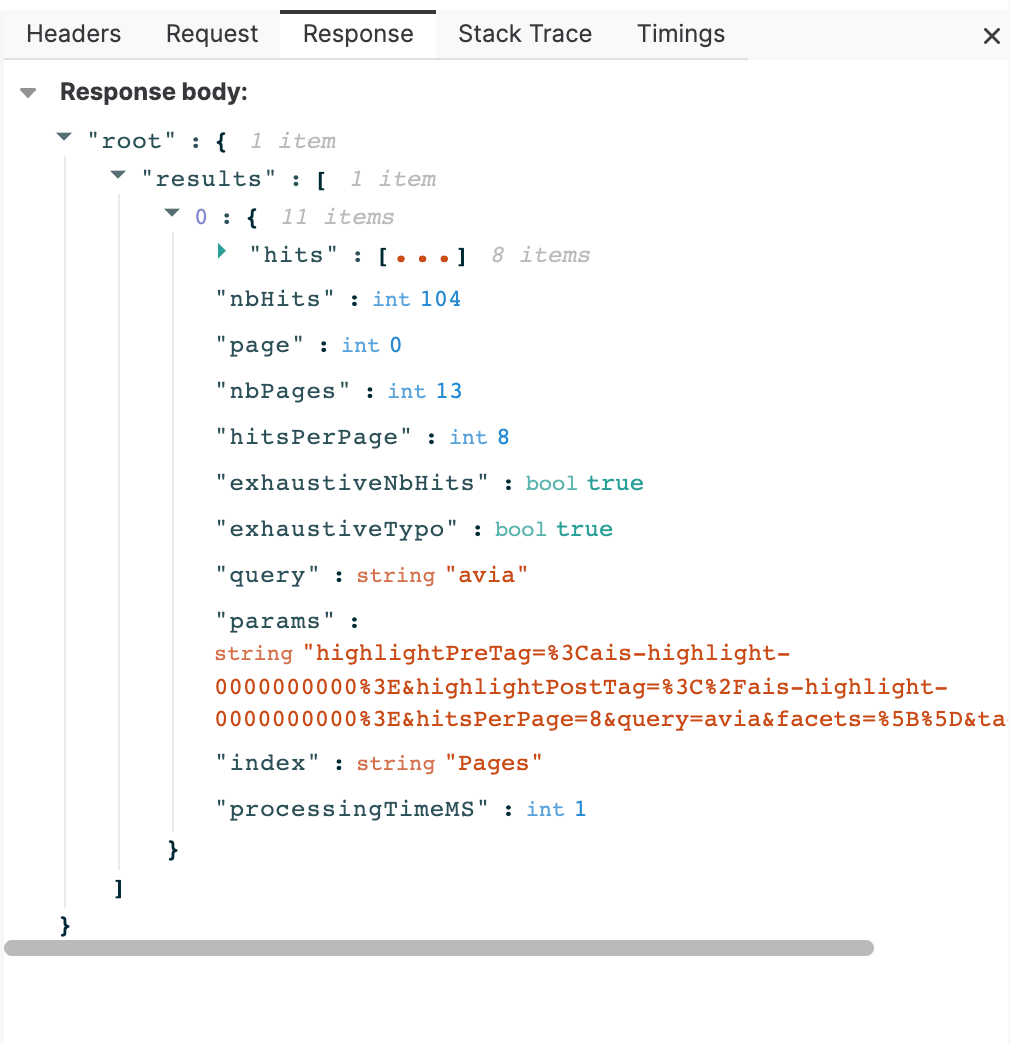
The Response tab shows response bodies if one was received.
The response body is previewed as JSON when available. Otherwise it is shown as a raw value.
Click the arrows to expand values within the response body.
Why doesn’t Replay capture some response bodies?
There’s a lot of diversity in how browsers handle HTTP requests, and while we’ve tried to cover the most common code paths, there are still some types of requests for which we won’t capture full information (like response bodies). As a rule of thumb, if your request is done via XHR or
fetch, you should see it’s entire details, including request and response bodies. We also capture the response bodies of requests that are triggered by the src attribute of img tags. We’ll be continuing to expand the variety of network requests that we record, and if you have any questions or want to request a particular use case please hop into our discord and share it with us! Why does this response body need to be downloaded?
All responses are recorded as binary data. We depend heavily on the
content-type header of the response to decide if we should try and display a particular binary stream as text. In cases where the body is valid UTF-8 but the content type is unclear, you might have to download the response in order to properly view it.Inspecting stack traces
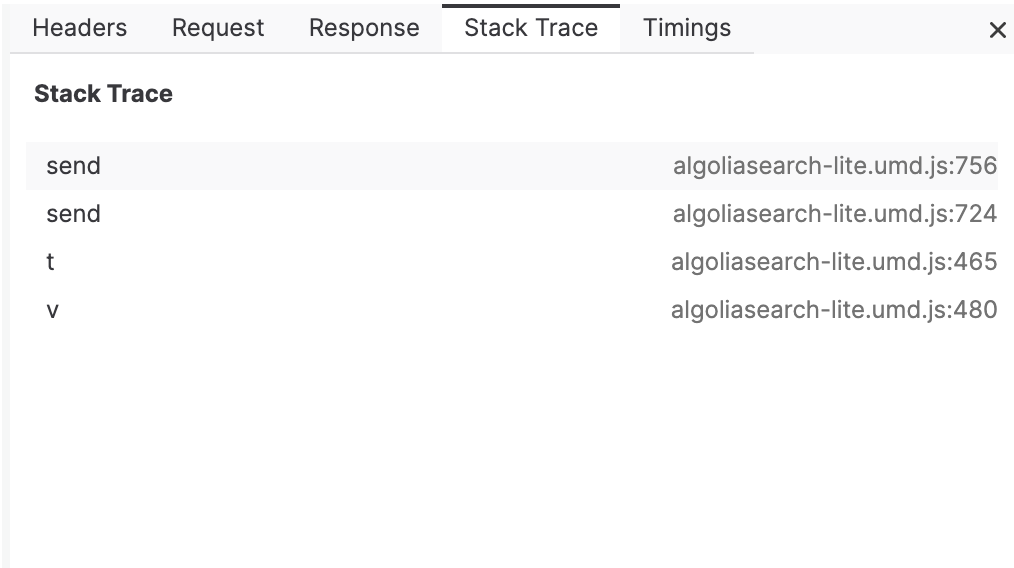
The Stack Trace tab shows where the request initiated in the application code.
Click on any row in the stack trace to open that line of code in the Editor. (The Editor must be open before clicking.)
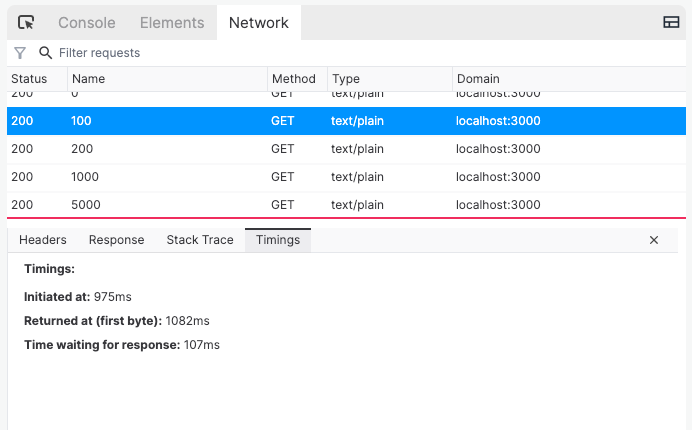
Inspecting timings
The Timings panel shows the time in the replay the request was initiated and when the response returned. The response timing is when the response first returns from the server, and does not include time transferring the response body.
The Time waiting for response is the difference between the request initiation time and the first-byte response time.
Timings are relative to the replay and are a best effort representation of when events happen related to network requests. Some responses requiring additional processing or decoding may affect the precision of the timing calculations.
Commenting on network requests
Click in to any network request to add a comment to that specific request. Once added, clicking on the comment will open the request in the Network Monitor.
