
Replay’s DevTools has six primary panels for inspecting the replay:
🧱 Elements Inspect ui element styles and attributes
🖨️ Console Inspect logs, exceptions, errors, and events
📡 Network Inspect network activity, requests, and response bodies
⚛️ React Inspect react components, their state and props
🔍 Search Search files, functions, and text
⏸️ Pause Inspect the call stack and scope
Want to know how to best use these features for debugging? Check out Debugging.
You can also view Events from the Replay Info panel in DevTools or Viewer mode.
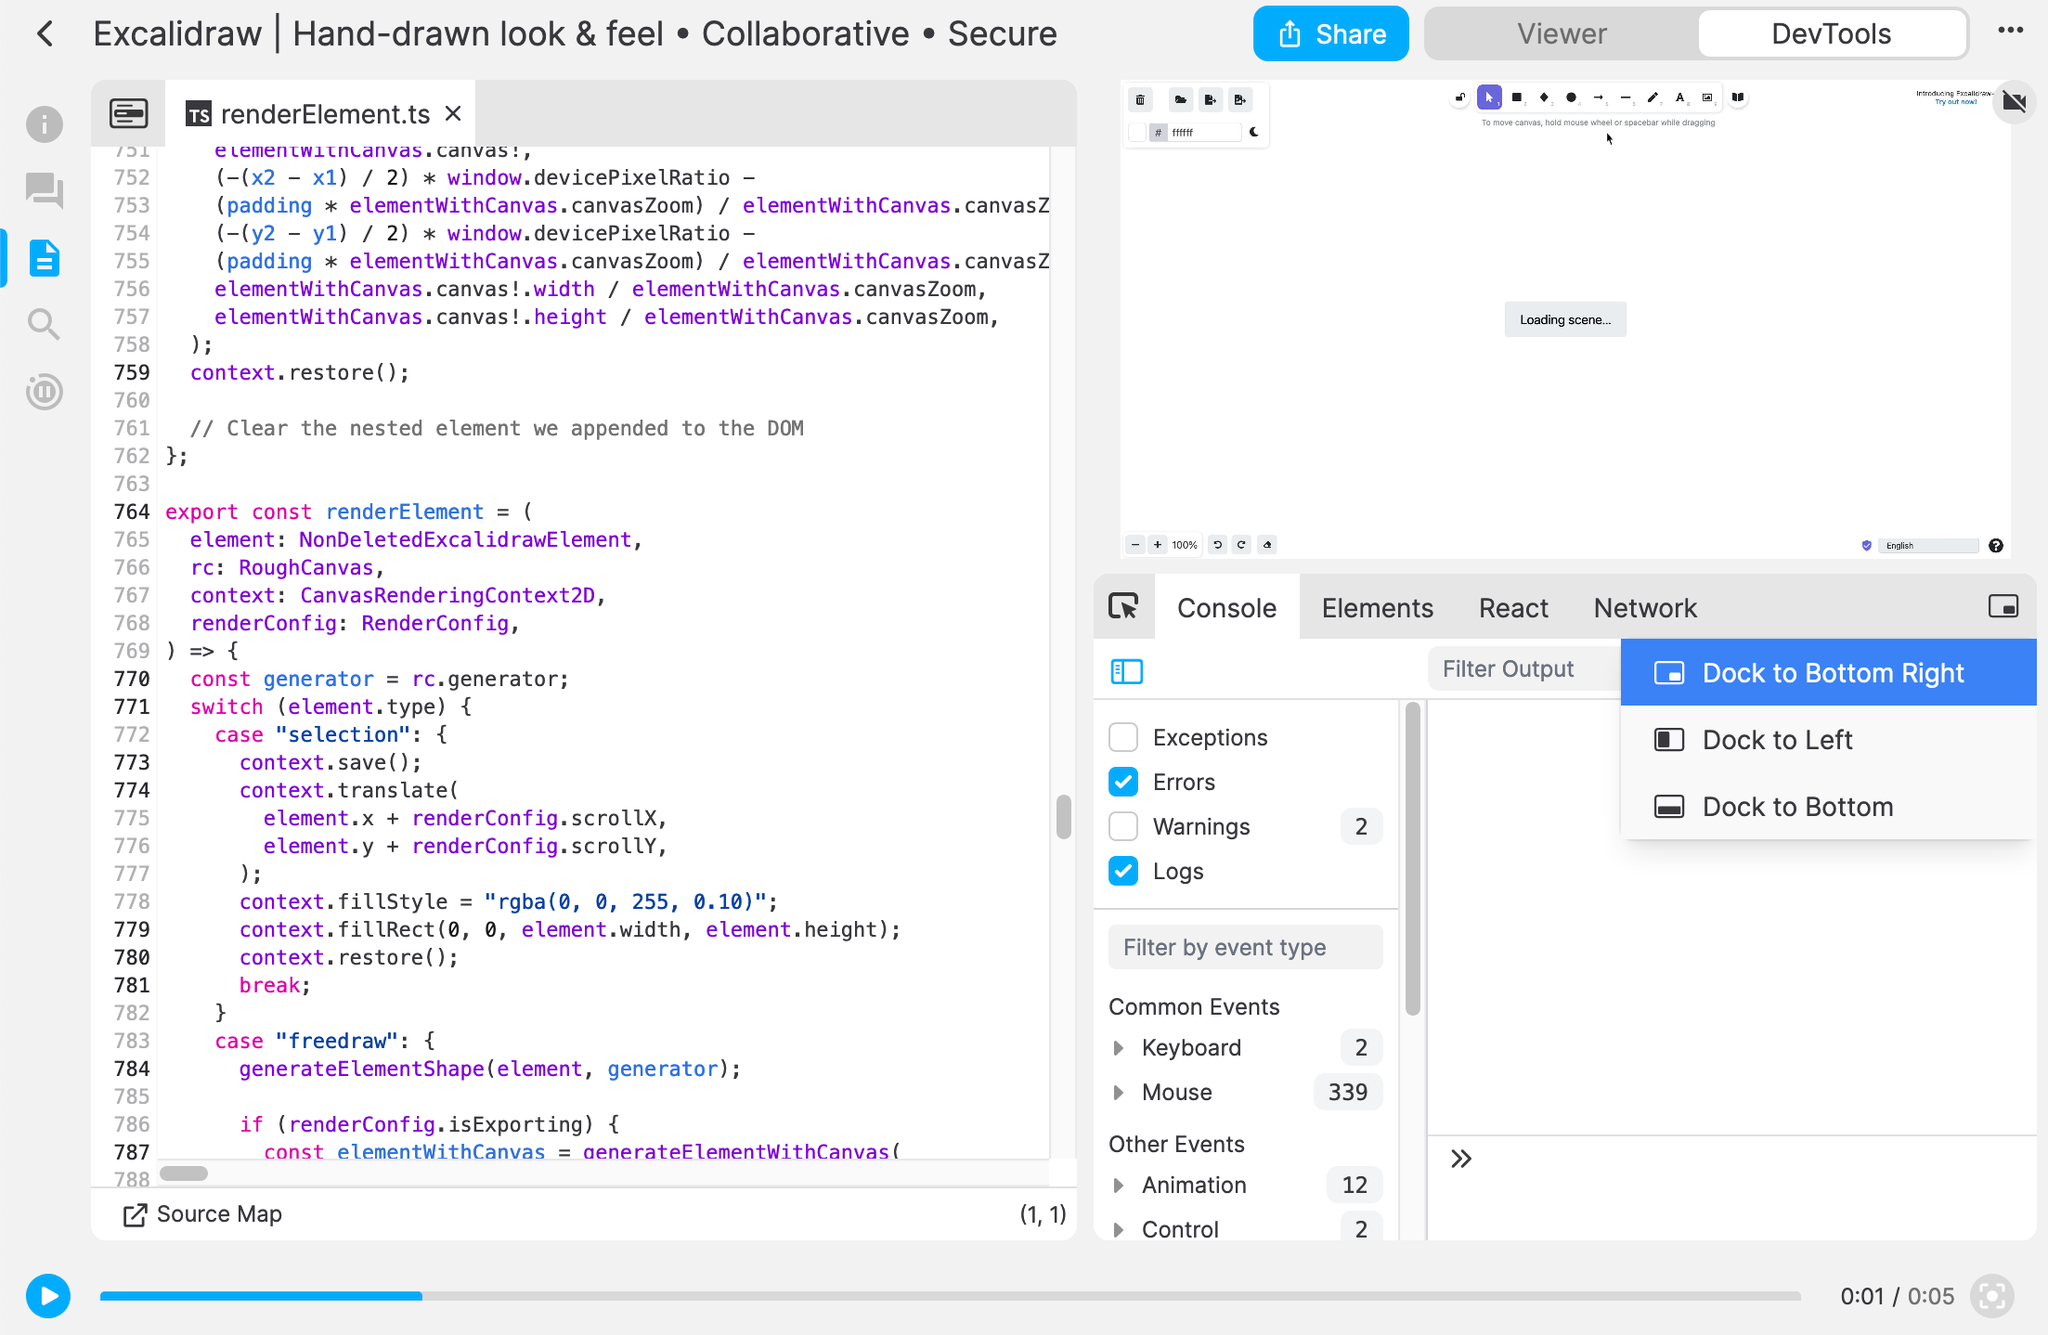
Layouts
DevTools has three layouts:
- Dock to Bottom Right: Sources panel on the left and secondary panels on the right. (default)
- Dock to the Left: Panels are on the left of the video. For when additional vertical space is needed.
- Dock to the Bottom: Panels are below the video. For when additional horizontal space is needed.
Select a layout using the icon on the upper-right of the Console. You can also toggle the video visibility in DevTools mode by clicking the video icon.
Shortcuts
While in a replay, you can use keyboard shortcuts to quickly access certain features.
Cmd in the list below is for MacOS users. On Windows, replace with Ctrl.Command | Function | Note |
Cmd+K | Open command palette | |
Cmd+P | Search for a file | Toggles to DevTools mode |
Cmd+O | Search for a function | Toggles to DevTools mode |
Cmd+Shift+F | Search full text | Toggles to DevTools mode |
Cmd+G | Search within file | File must be selected |
Ctrl+G | Go to line in file | File must be selected |
Cmd+B | Toggle left sidebar | |
Cmd+/ | Open shortcut menu | Only in DevTools mode |
F8 | Resume | Only in Breakpoints |
F10 | Step Over | Only in Breakpoints |
F11 | Step In | Only in Breakpoints |
Shift+F11 | Step Out | Only in Breakpoints |
Shift+T | Toggle Dark Mode | |
Shift+F | Toggle Focus Mode |
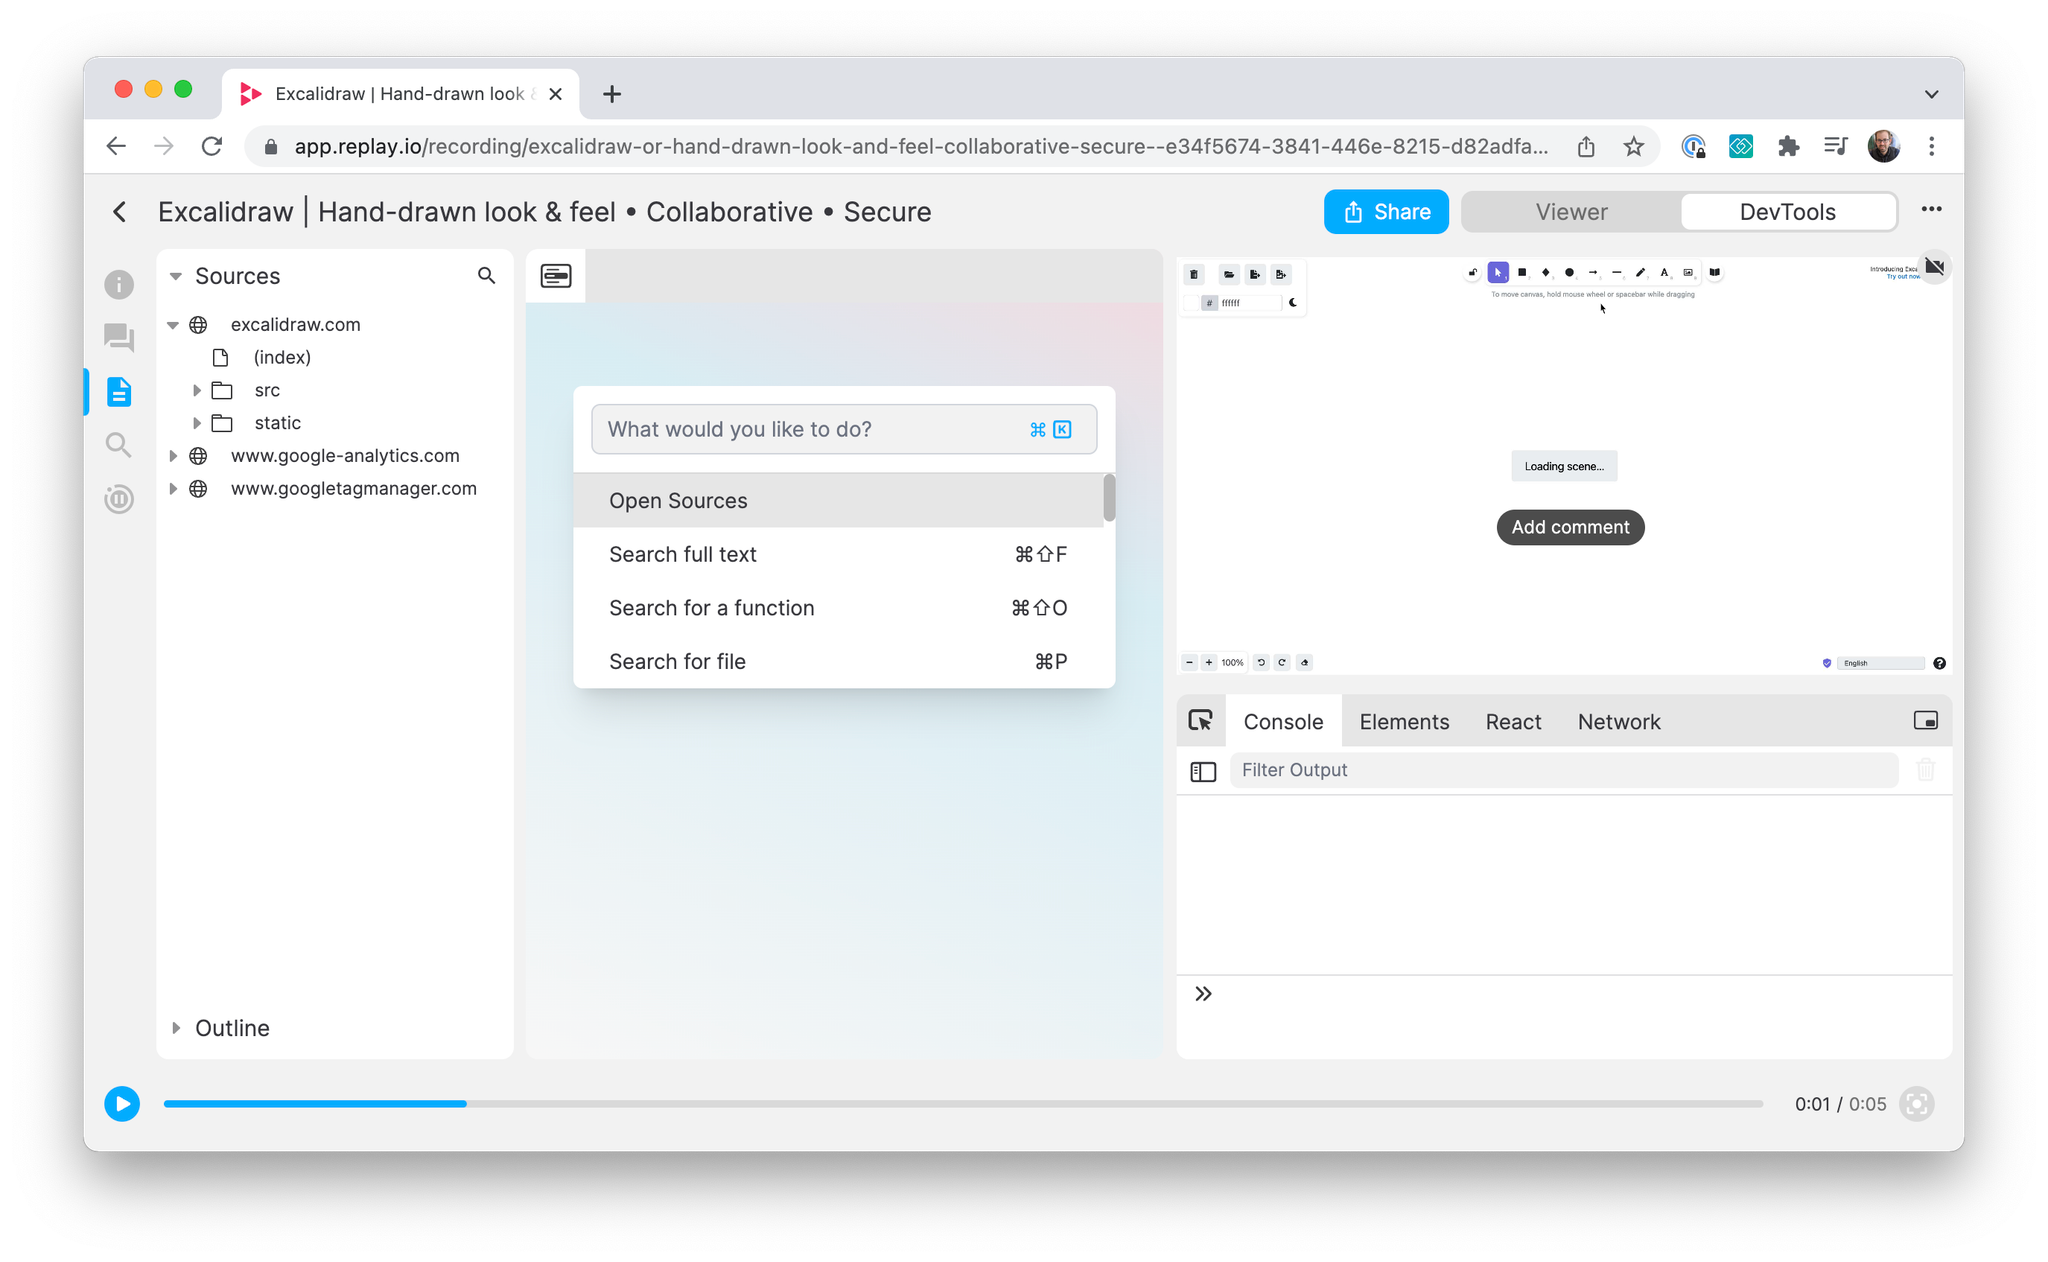
Command Palette
Quickly navigate to DevTools Panels and perform actions like searching or opening modals. Access the Command Palette from the Sources panel or with the
Cmd+K shortcut.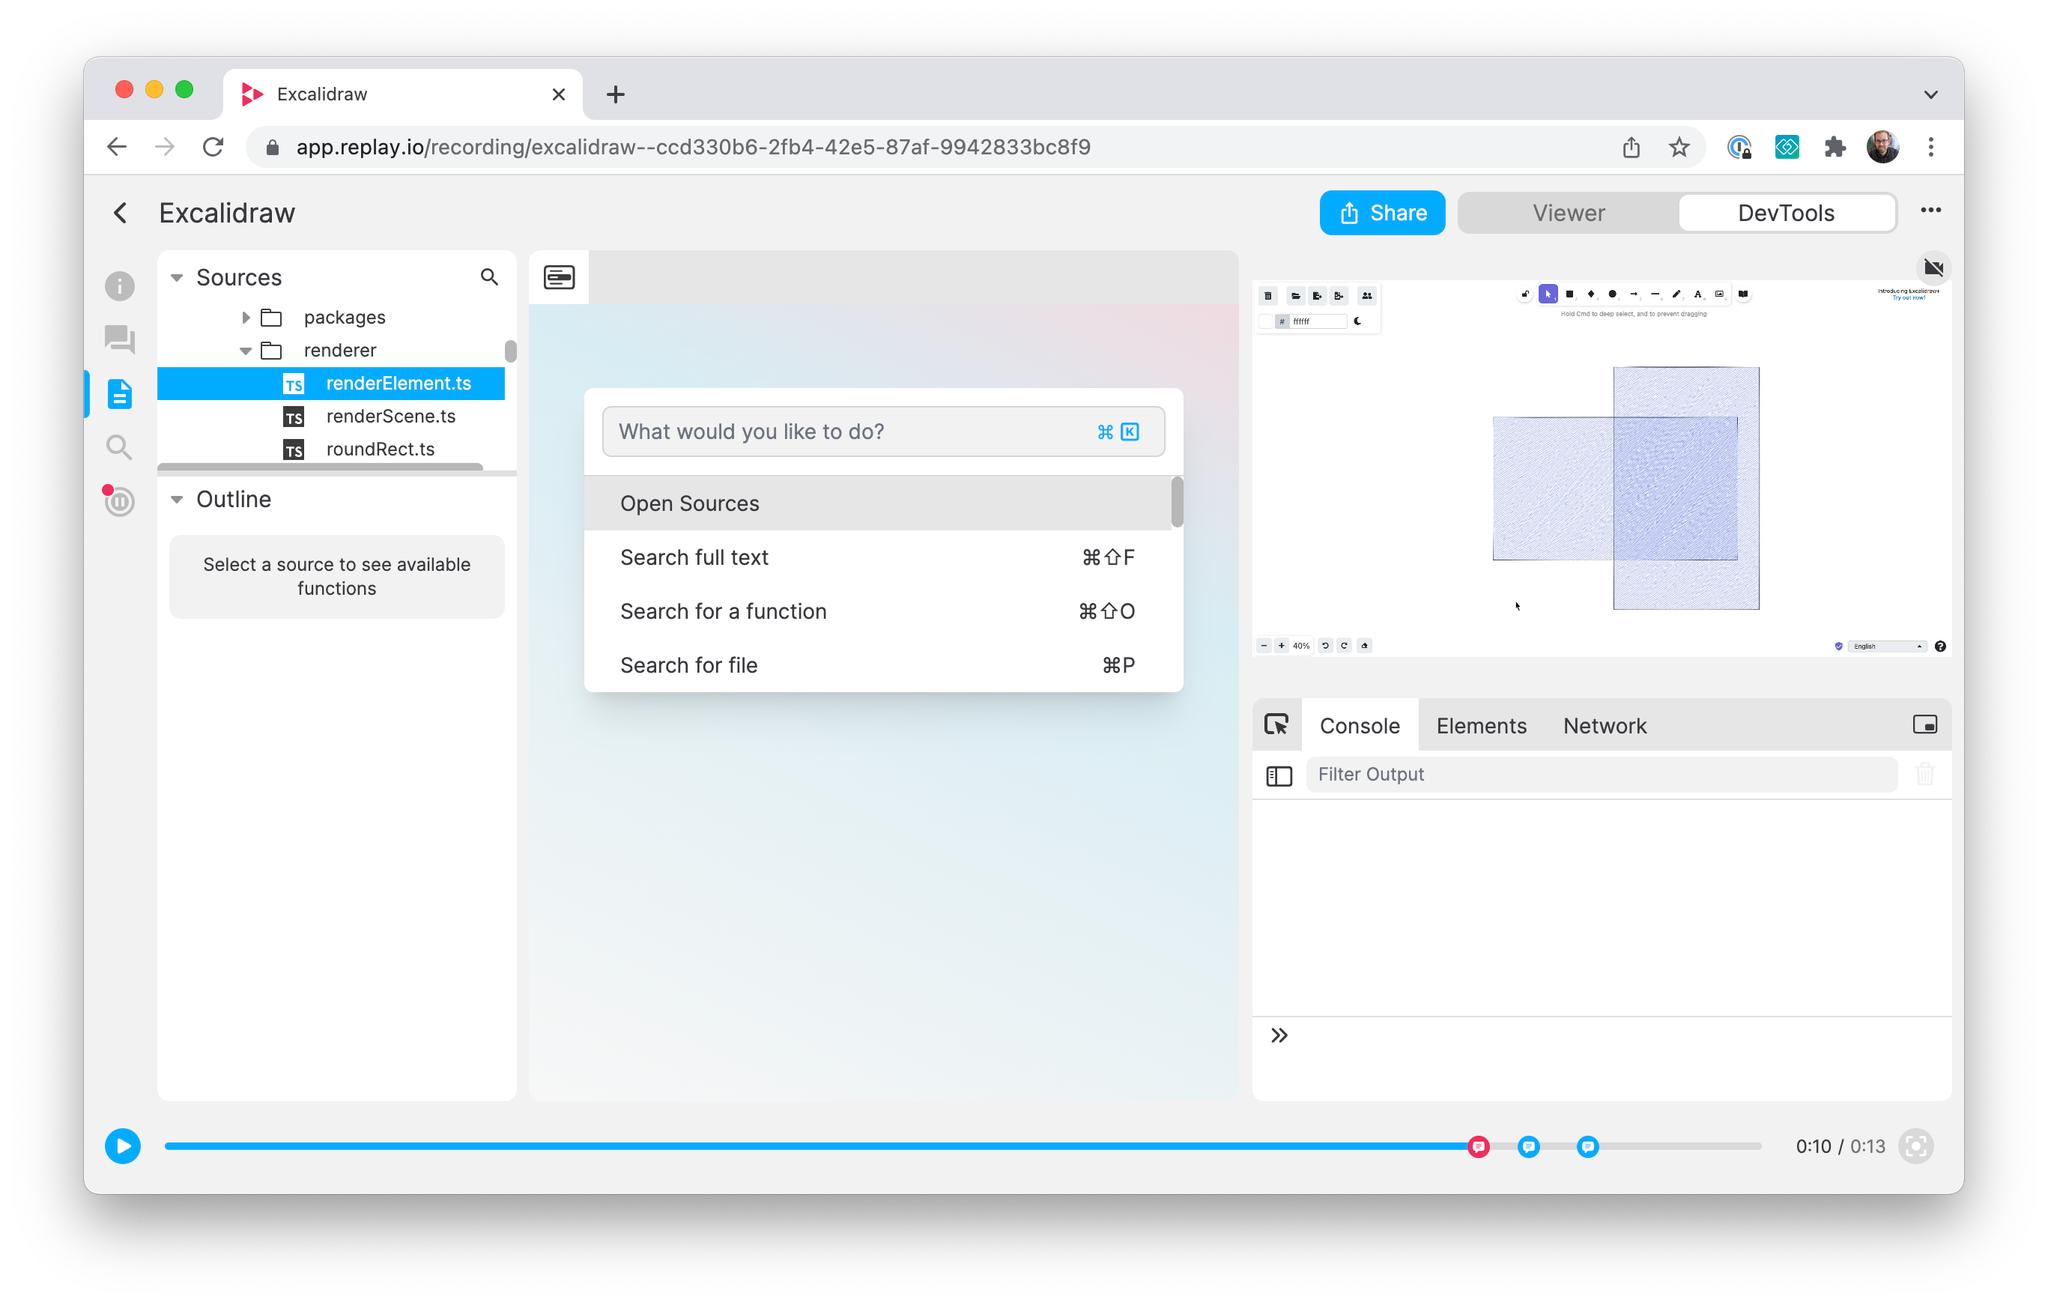
Examples:
- Open the Network Monitor
- Show comments in the sidebar
- Launch the Sources Search modal
The Home button in the top left of the Sources panel navigates to the Command Palette.