Replay's console is similar to console you know and love in Chrome DevTools, except there are a couple of new tricks.
Fast forwarding to a message ⏩
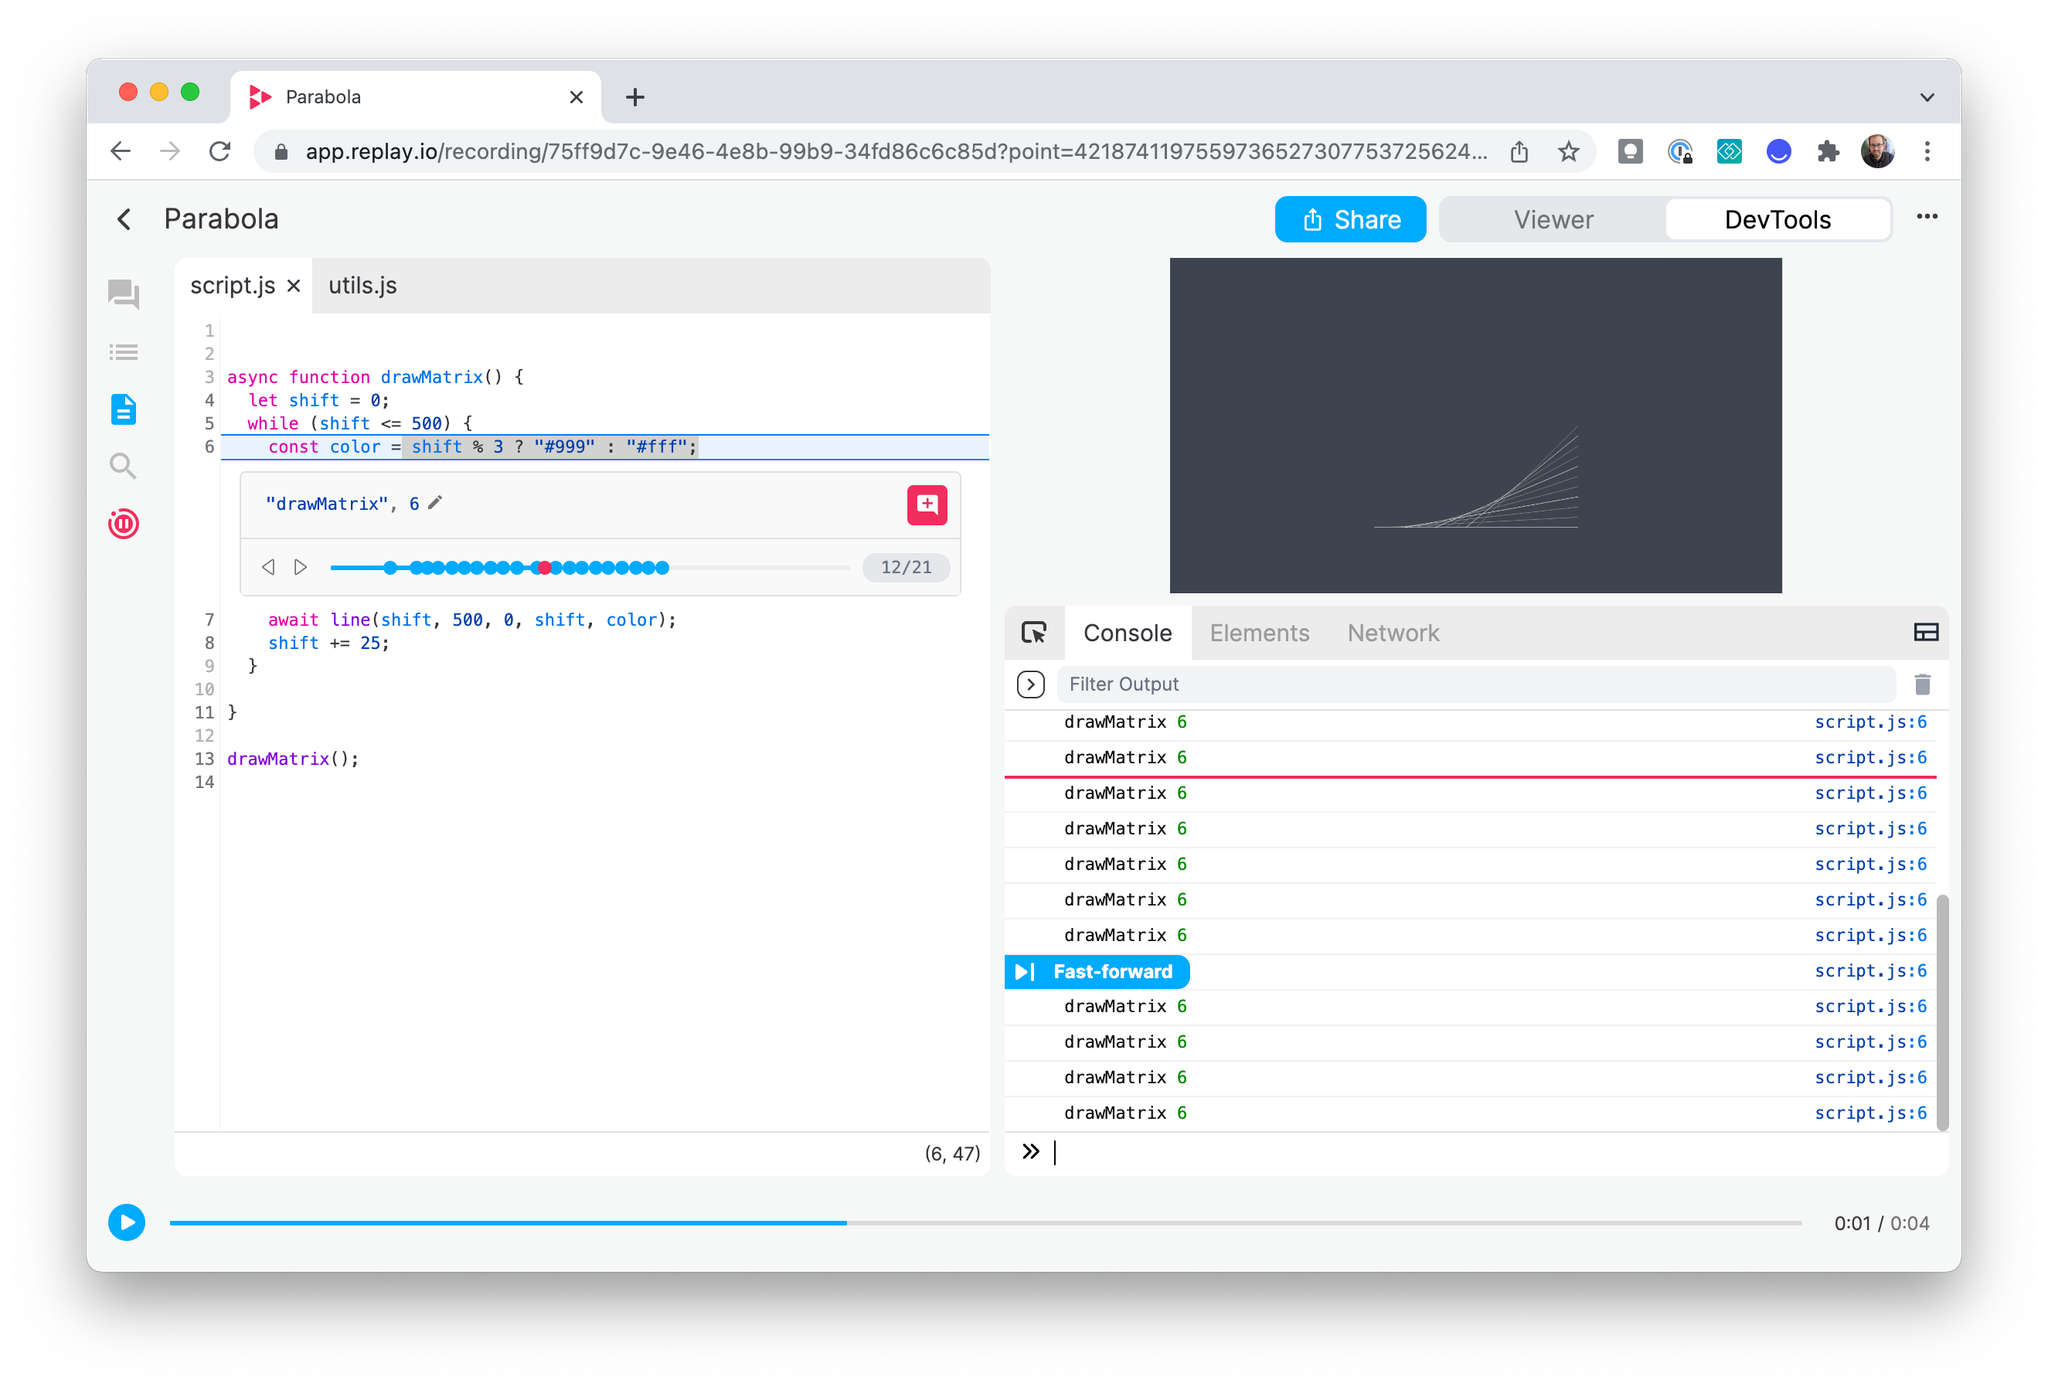
The biggest new trick is the ability to fast forward and rewind to any message by clicking the blue buttons that appear when hovering on a line in the console.
You can jump between console messages generated from your application, or ones you’ve added with Replay’s print statements feature.
Evaluating expressions ➡️
Replay's console terminal lets you evaluate expressions like you would in a browser console. You can think of this like a playground for running JavaScript expressions and operators.
In general, expressions will be evaluated in the global context. When you are paused at a line of code, the terminal will use the current pause frame or selected frame in the call stack.
Type in the console by the >> icon to evaluate an expression.
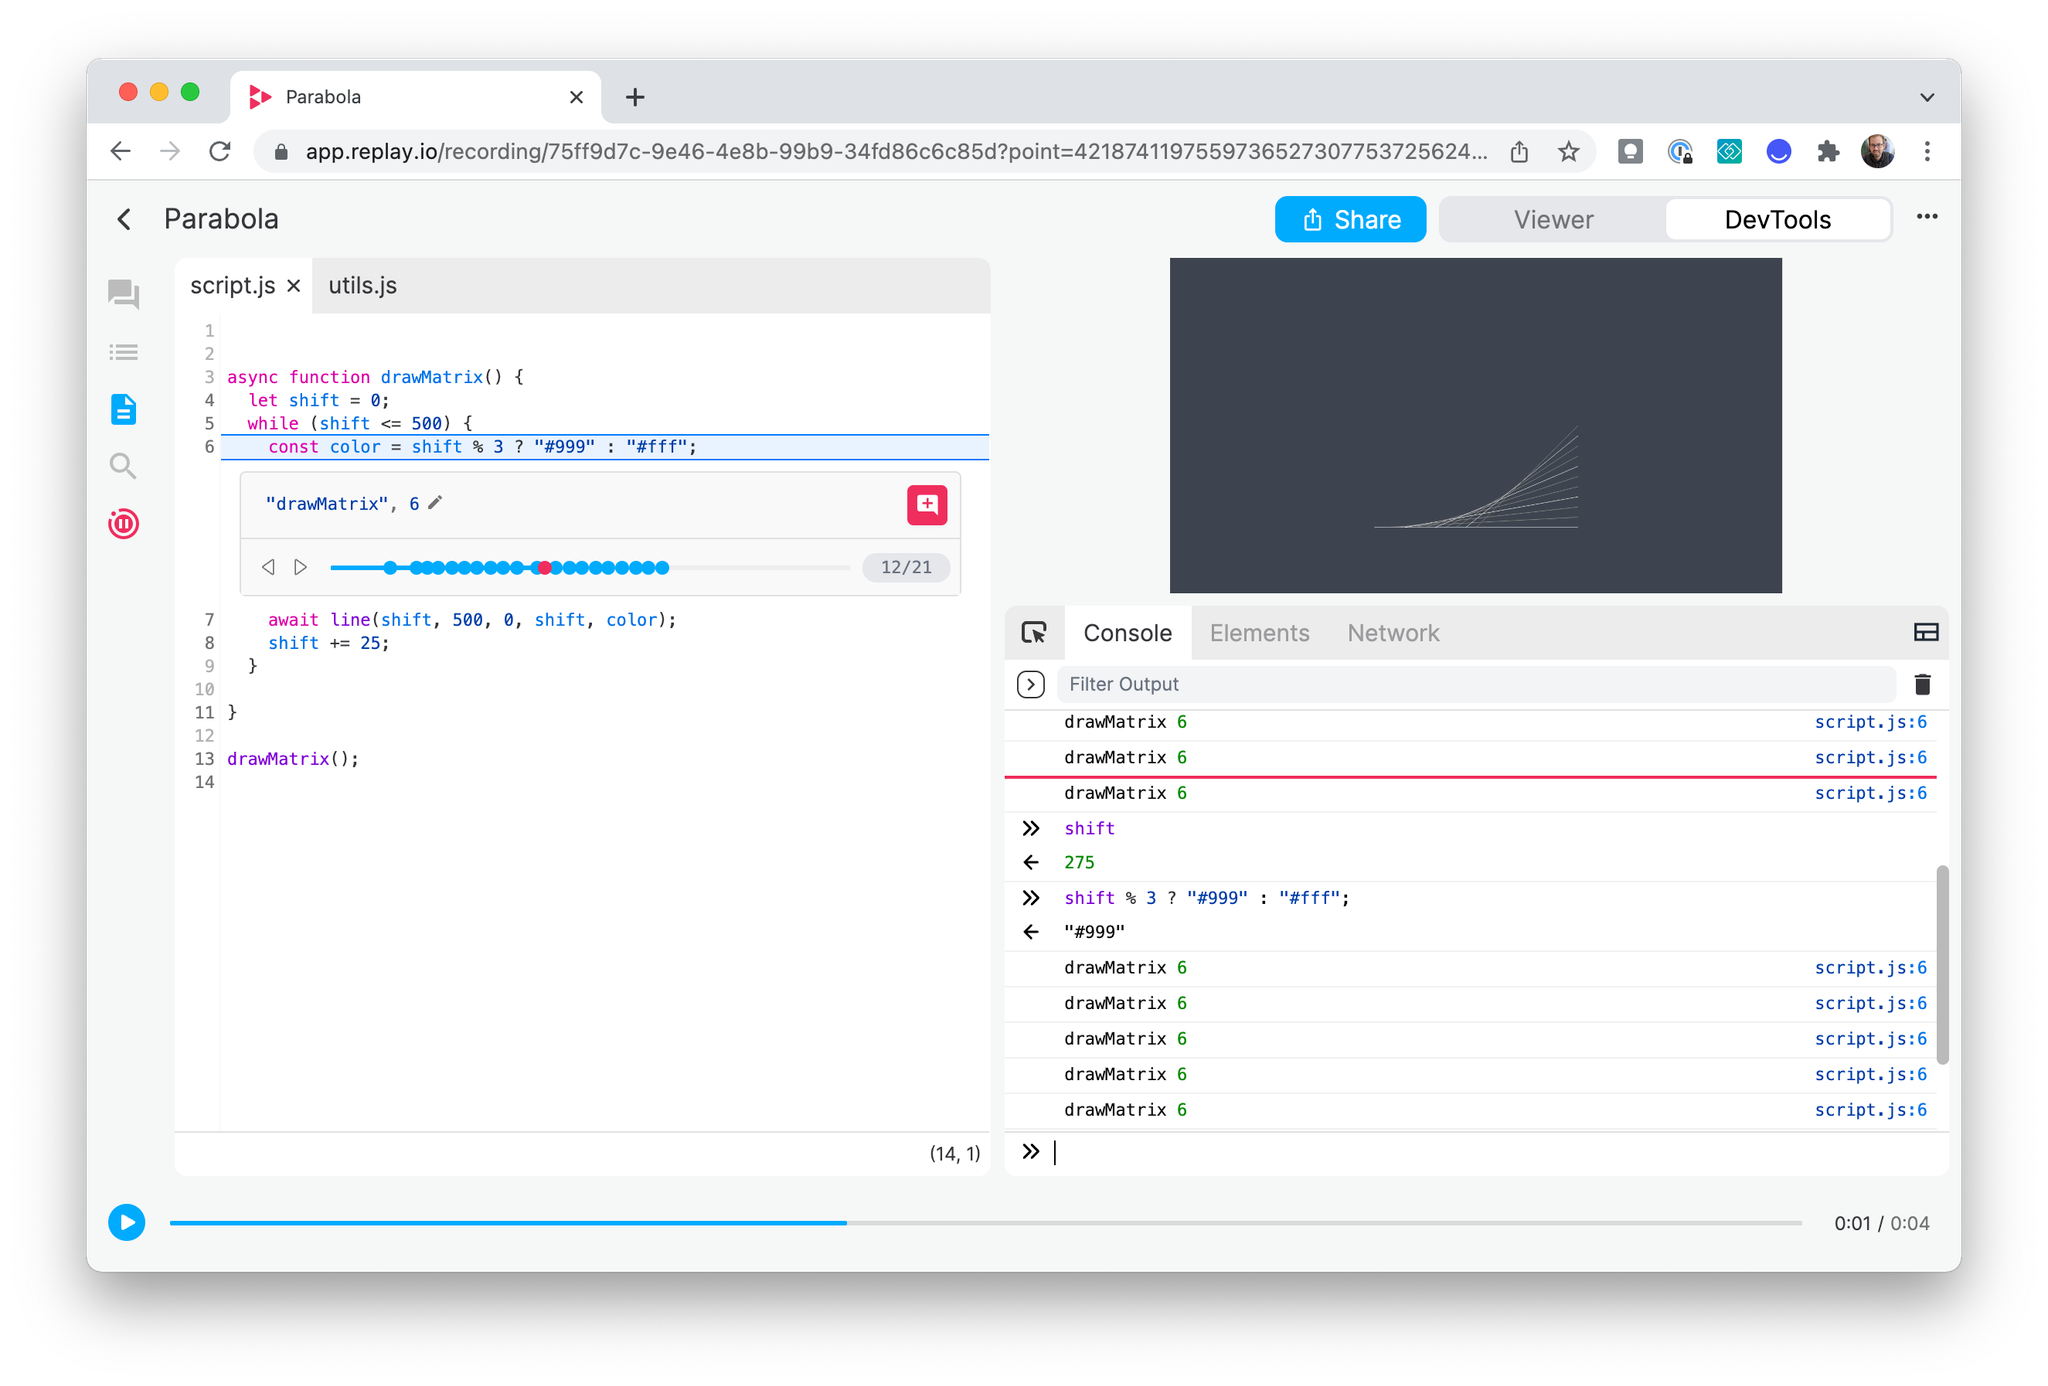
In the example below, we are paused on a specific marker for an instance of line 6 within
drawMatrix . Because we are paused, the expression shift evaluates to 275. Notice the expression evaluates at that moment in time in the console, before the next function execution occurs.
Click the trashcan icon in the console to clear any evaluations and results.
Autocomplete ⤵️
When typing in the terminal, you will see autocomplete suggestions. Autocomplete is one of those features that help you get into a state of flow.
Inspecting objects
Clicking on an object lets you see an expanded view of its properties. Unlike traditional consoles which will show the object’s property values as they are now, when you expand an object in Replay you will see the values as they were when the message was logged to the Console!
Viewing stack traces
Replay Errors can be expanded to view the stack trace and see where the error originated. Clicking on a stack trace function or source location will navigate the Source Editor to the line of code.
Console message types 🔽
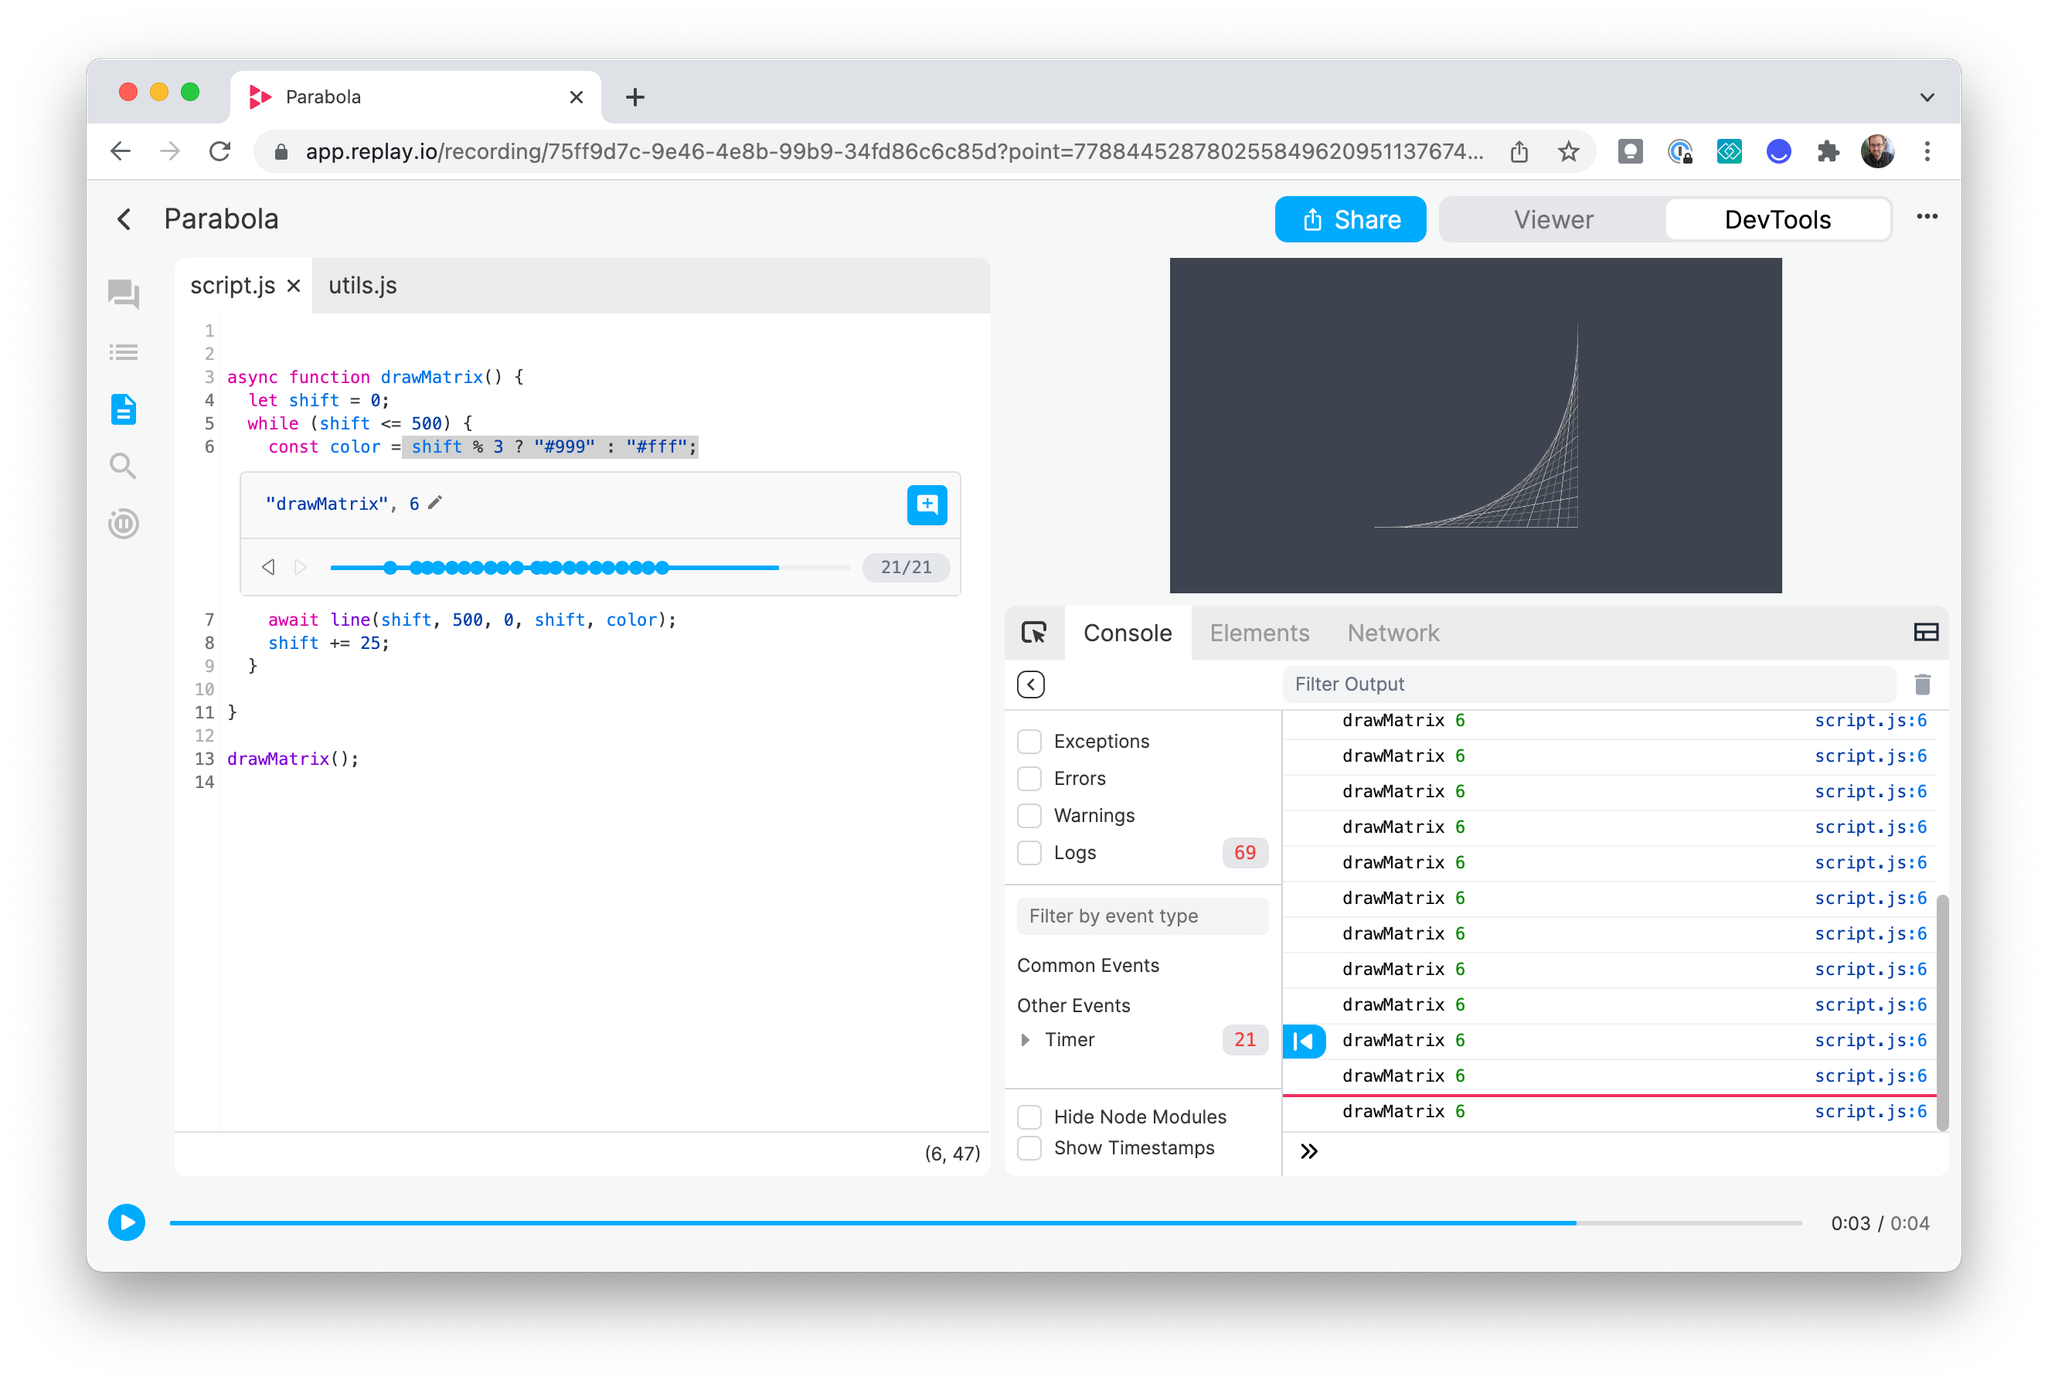
The console settings panel is useful for filtering console exceptions, errors, warnings, and logs when they are not helpful. It's also possible to filter console logs by adding a query in the filter bar.
Viewing event listeners 7️⃣
Replay can show event listeners for mouse, keyboard, worker, and any other standard event in the console. You can toggle which event listeners are output in the console in the same console settings pane. Check out Events for more details on event types.
Searching & Filtering messages
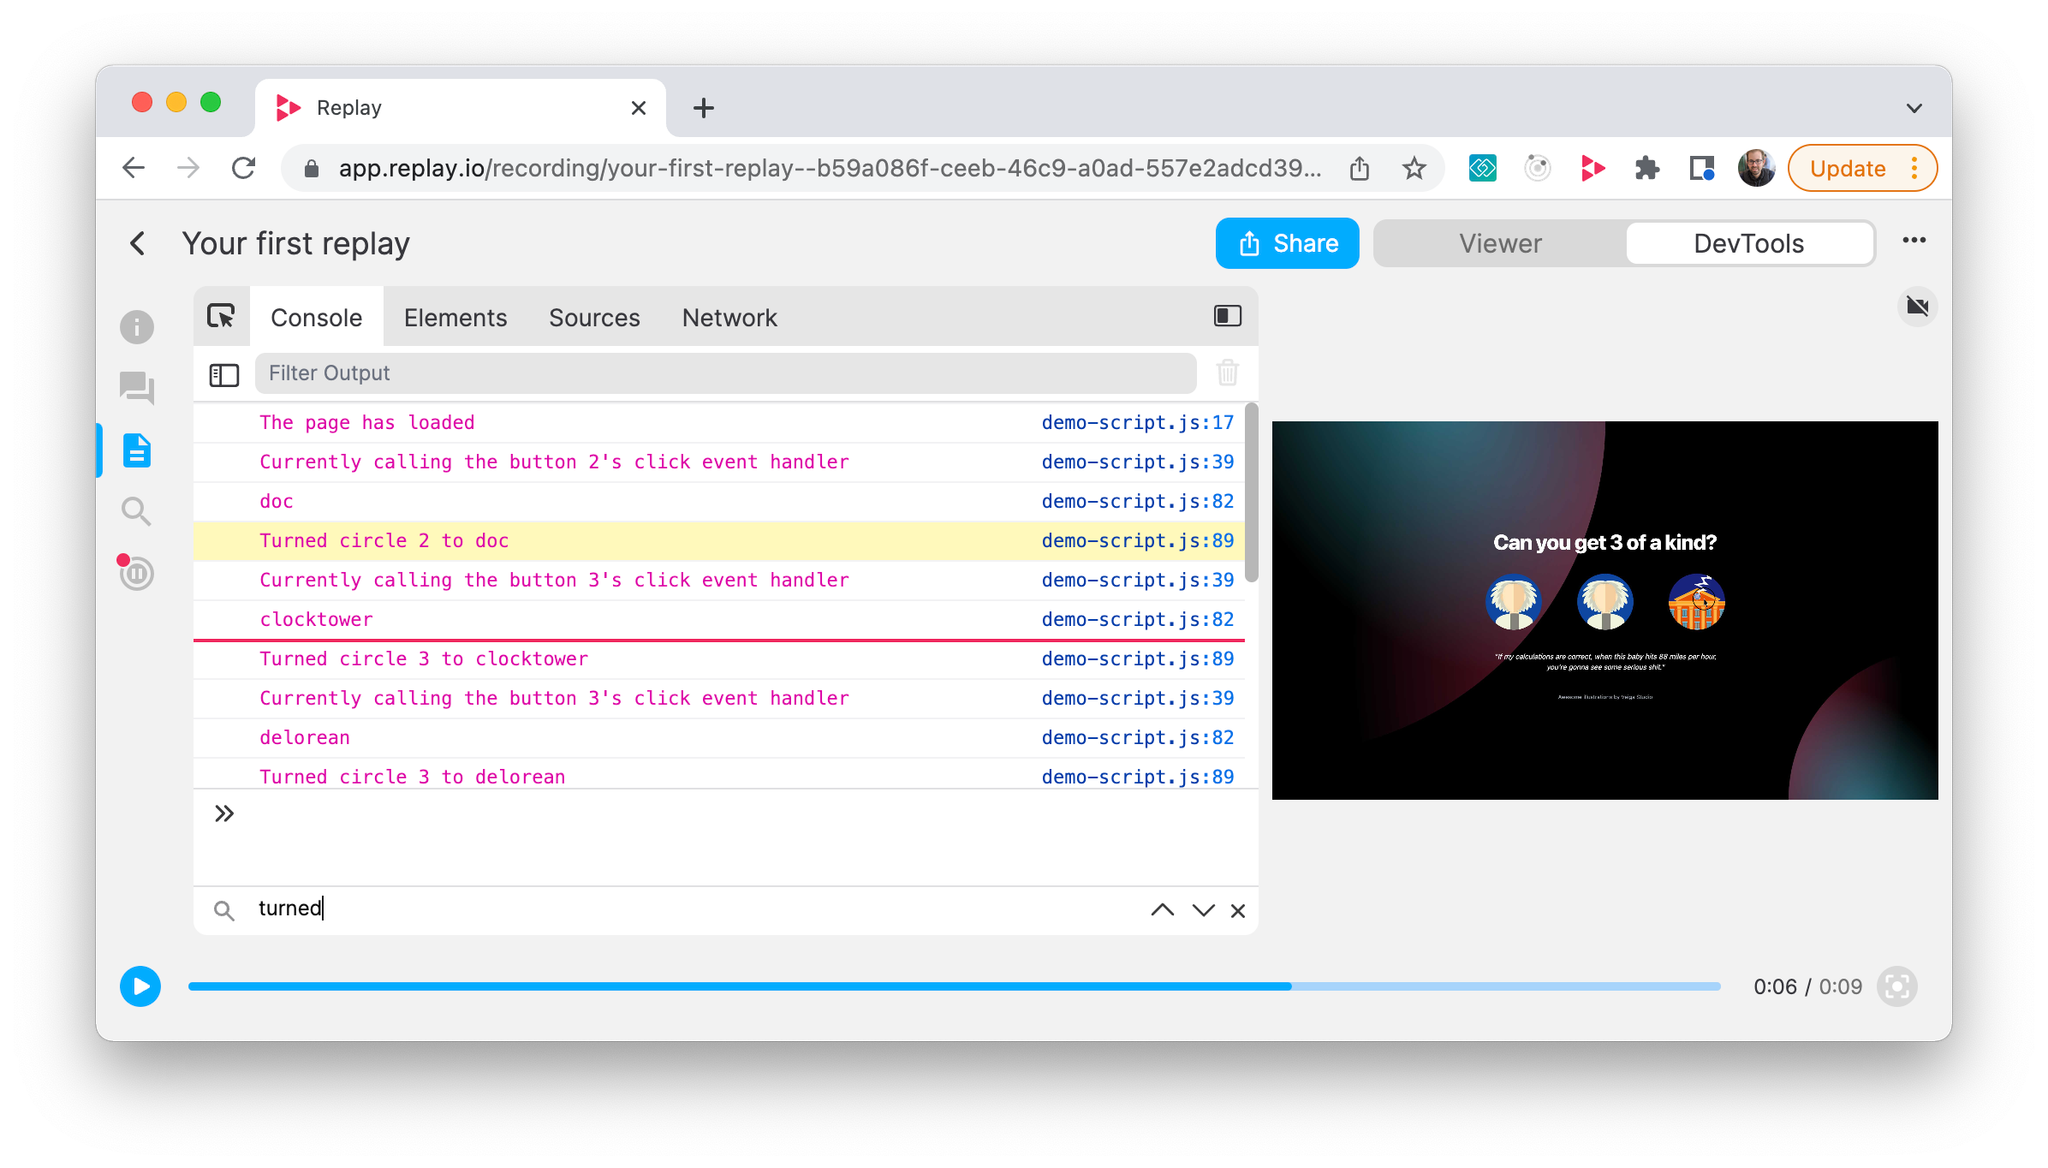
Console messages can be filtered via the filter input in the Console Header. You can also search console messages by pressing
cmd-f and adding a query in the search input in the footer. In general, filtering is useful when you want to narrow the results don to just the matching messages and searching is useful when you want to quickly jump to a matching message.
Object Getters and Setters ↔️
Here’s an example replay for playing with Getters and Setters that is used in the screenshots below. Check out this video on Twitch of the example.
You can view object getters and setters three ways:
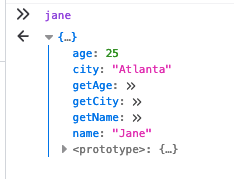
- Getters will show in the object details when logged to the console.
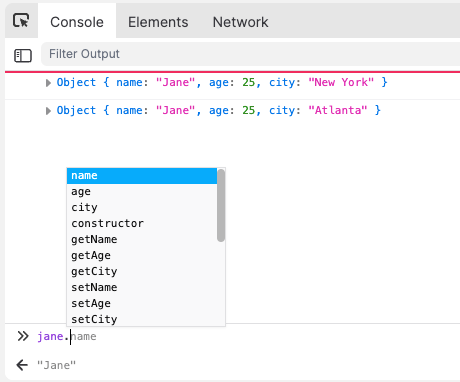
- The getters and setters will populate with autocomplete when inputing an object in the console.
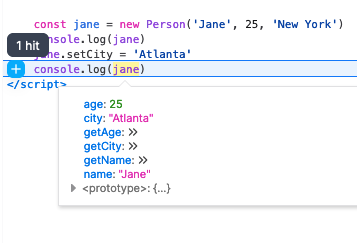
- When viewing an object in a source, the object details will list the getters.
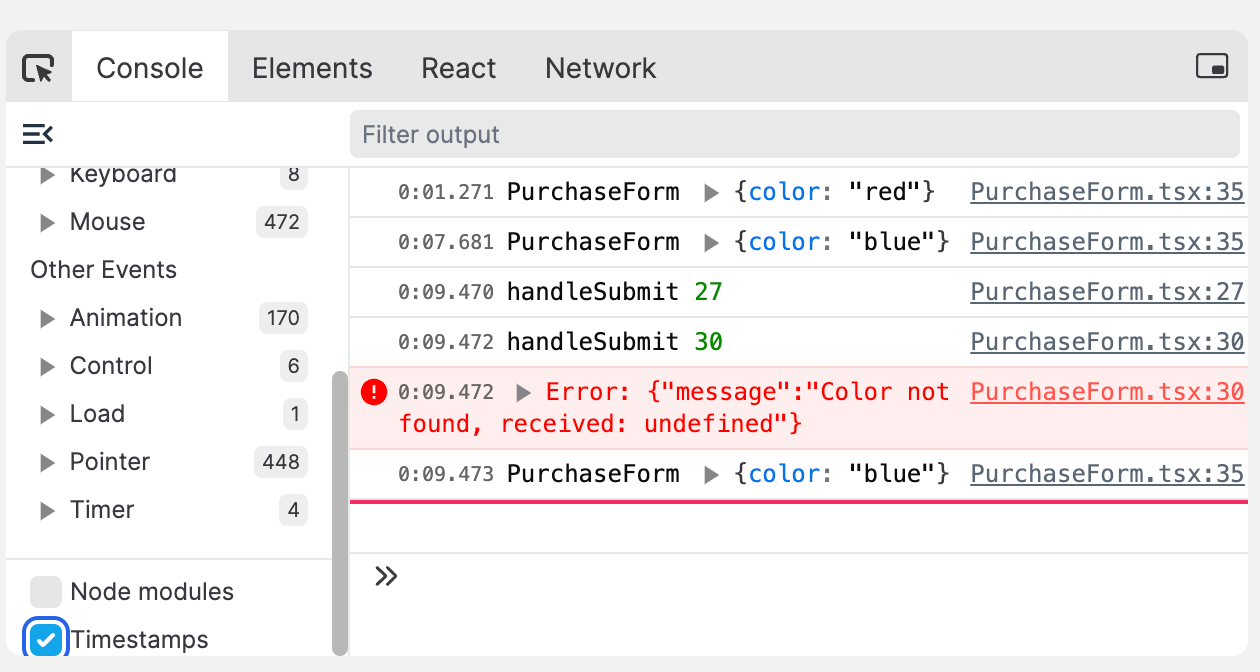
Viewing Timestamps
It’s possible to view the timestamp for each console log by selecting Timestamps in the bottom of the drawer