
Replay’s Source Explorer panel shows the source files captured during the recording. Within the panel, Replay adds functionality for interacting with sources for debugging.
For more information on searching for source files, check out Search.
You can also open the panel by clicking the page icon in the sidebar, then selecting a file.
Source Explorer
Print Statements
Add a print statement on a line in a source by hovering on the line and clicking the blue plus button.

Searching Text
It’s possible to search the contents of a file by pressing
<cmd>+f and searching for the text.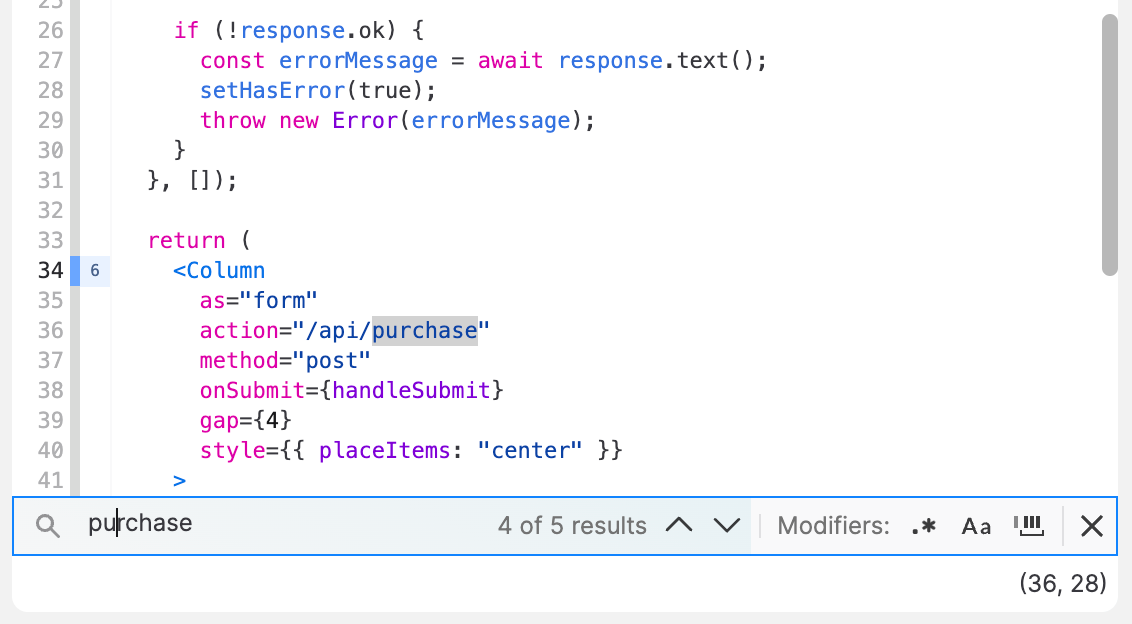
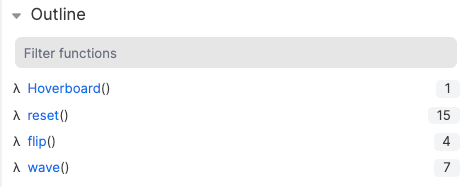
Function Outline
Under the Source Explorer, the Outline shows all the functions in the source and how many times each function was executed.
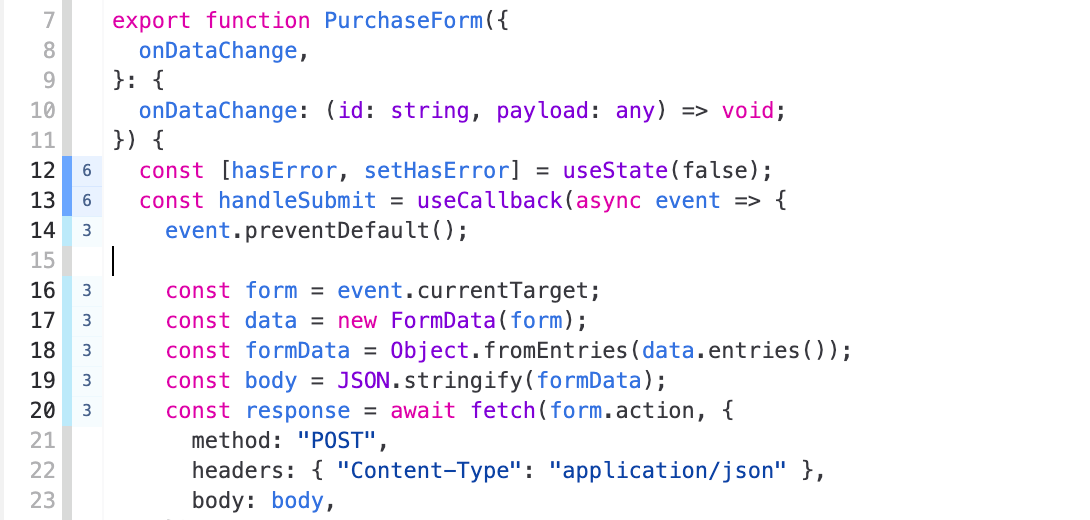
Heat Map
The Heat Map in the editor’s gutter is helpful for seeing how many times a line was executed. The color indicates the frequency a line was hit as compared to the overall source file (darker color for more hits).
By default, the Heat Map does not show hit counts, but if you would like to see the counts, you can click the color bar to expand.
Adding a comment on a source
You can add a comment to any line of code directly from the Editor. To get started, click on the number in the gutter of the source and click “Add comment” on the pop-up. The line of code will be referenced directly in the comment so others can easily connect your comment to the source.
Source Maps
If source maps were available during recording or uploaded to Replay, you can toggle between the bundled code and the original source in a replay.
The toggle in the lower-left side of a source will indicate if it is an Original Source file. Clicking the toggle will automatically open the corresponding bundled file.
Source Maps Visualization
The Source Map Visualization is useful for seeing how original and generated sources map to each other. The visualization can help trace issues in minified code back to the original code. The visualization can also help identify issues with breakpoints or minified variables in DevTools.
Read more about how we developed this feature in the blog post here.
If a source map is available, click the Source Map icon next to the Original Source toggle to open the Visualization. The Original Source is shown on the left and the bundled code on the right. Hover over values to see how they map between the source and bundled code.
