Overview
Playwright Trace Viewer is a Session Replay tool that captures application metadata like console logs, test steps, and screenshots while the test is running. Replay is a browser that lets you record your test and debug it later with retroactive print statements and Browser DevTools.
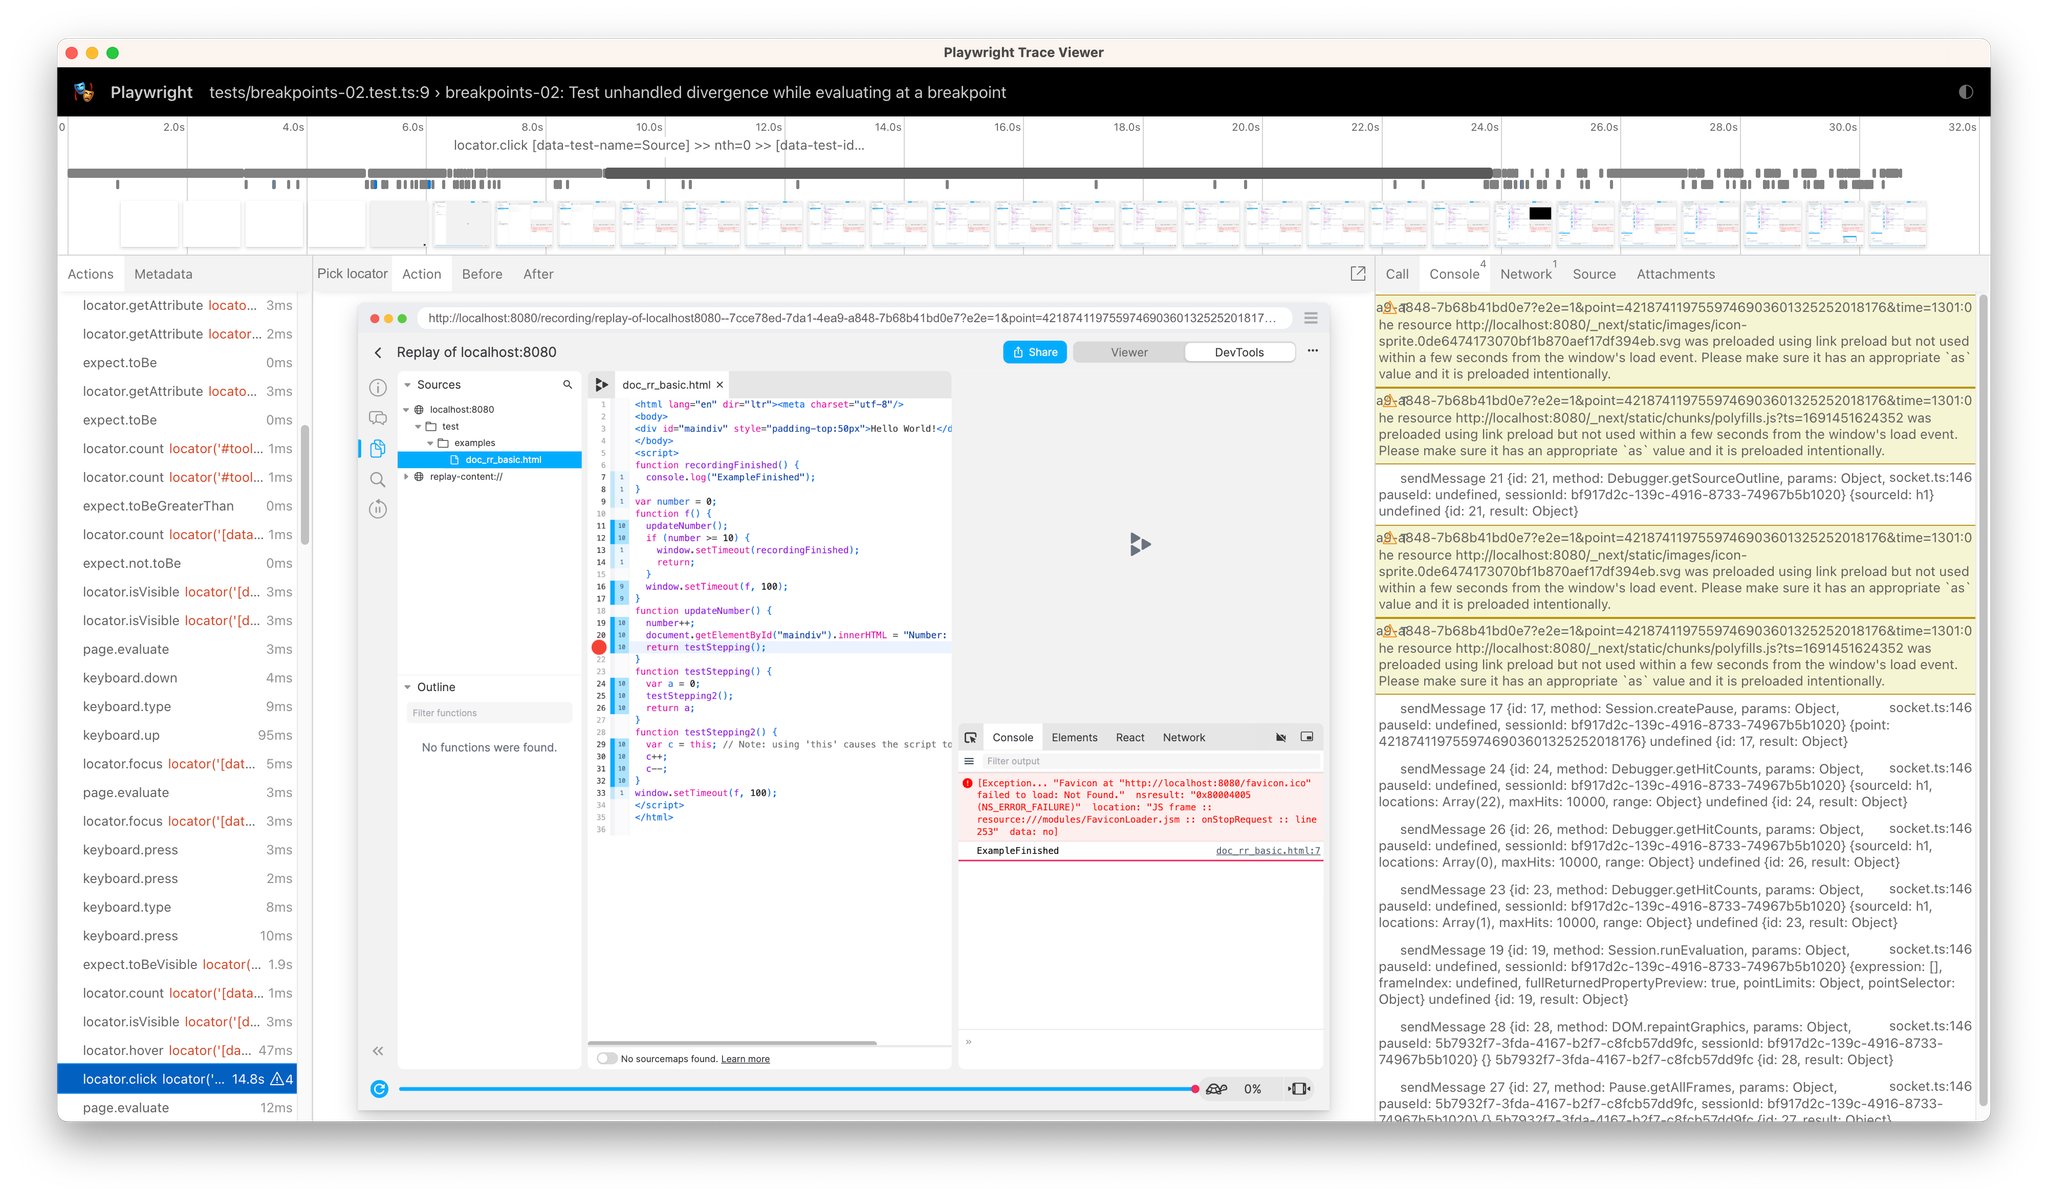
Here is a screenshot Playwright Trace Viewer for one of our Playwright tests. Apologies for the inception 🥲

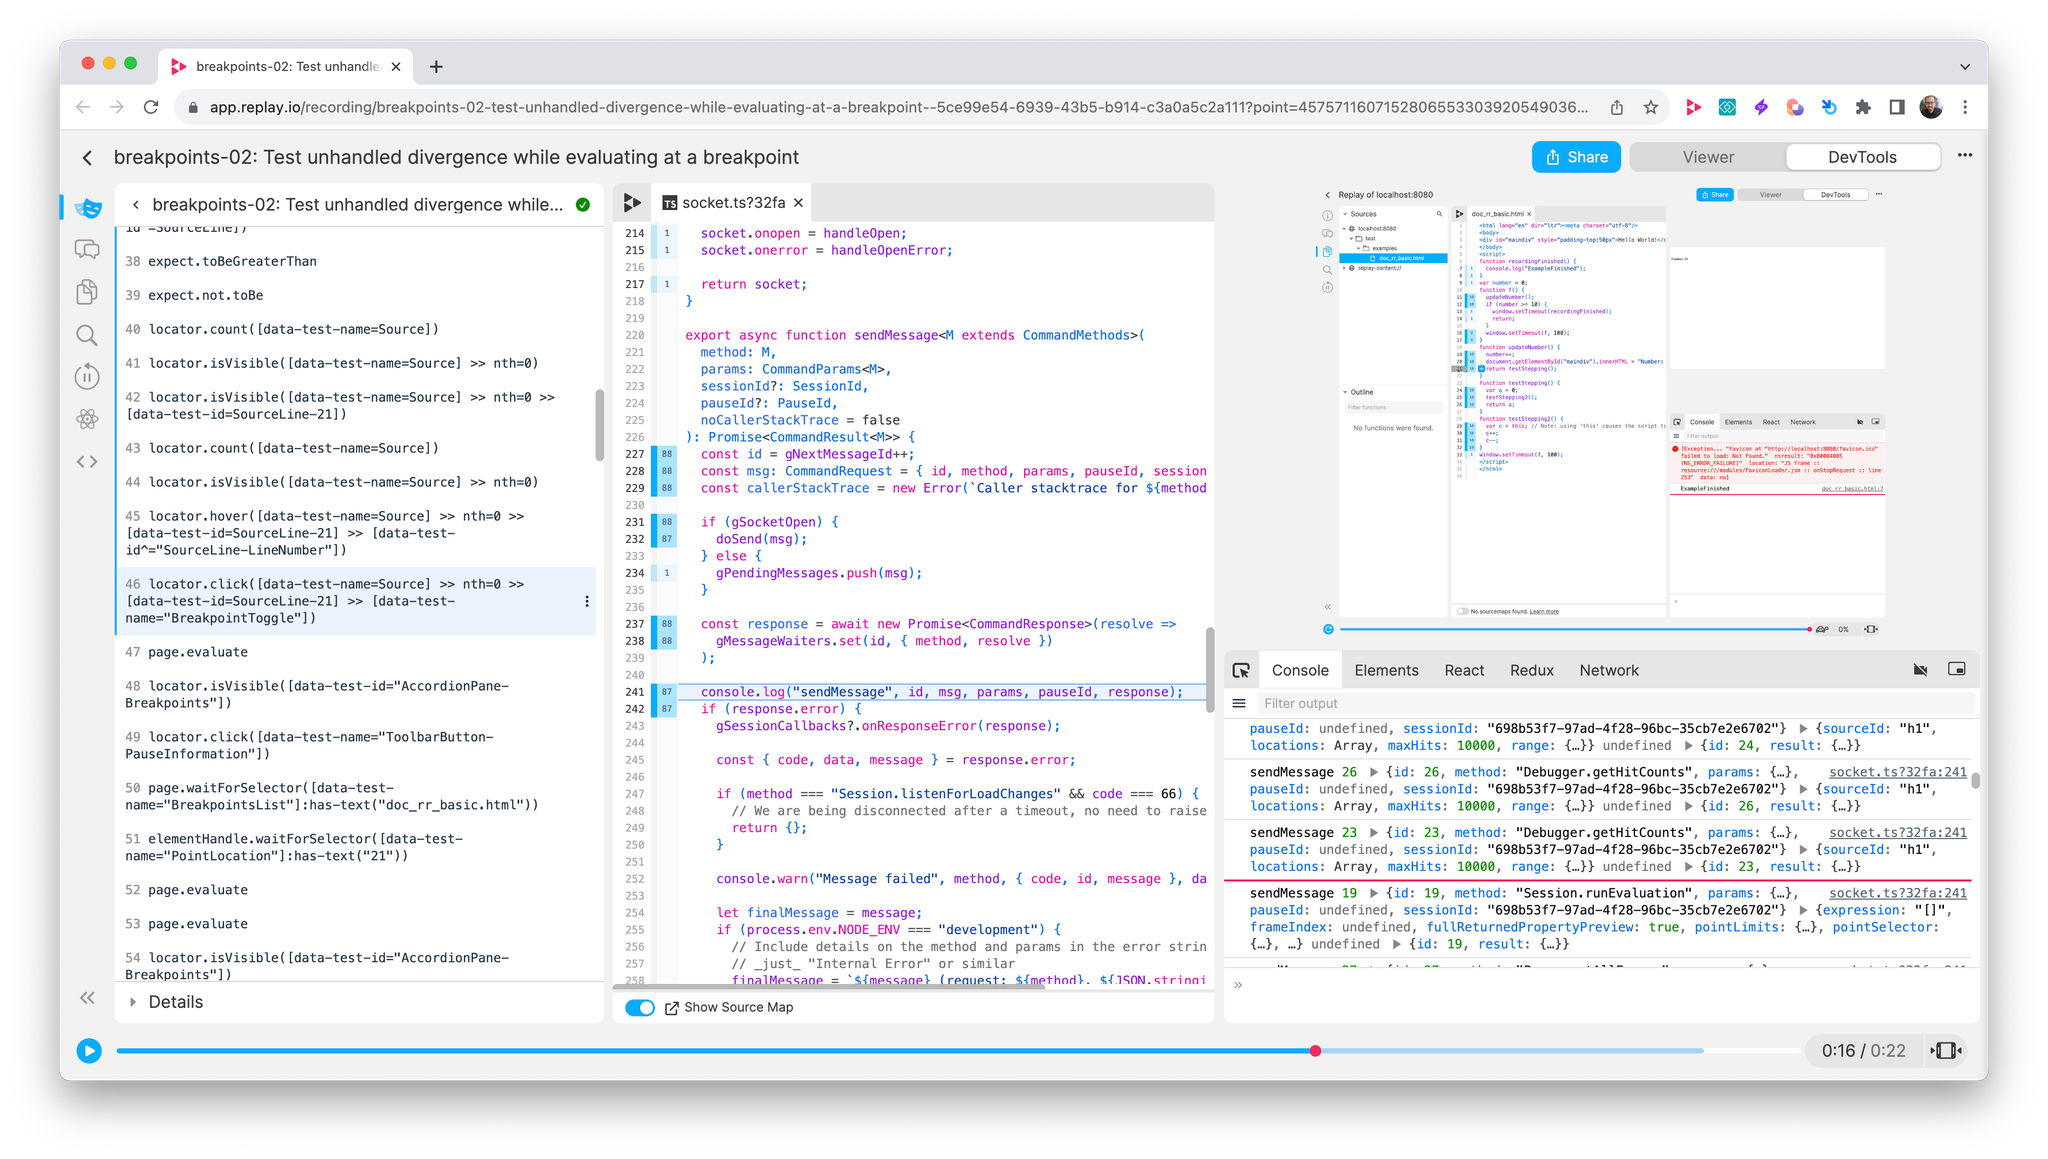
Here is a screenshot of Replay DevTools for the same test. On the surface, they might seem similar, but with Replay we’re able to dive in and inspect your application with Browser DevTools.

Time travel debugging
Because Replay is simply a browser, you can start recording your tests by adding
Replay Chromium in your playwright config here. And when you open a replay you can start time traveling!Retroactive print statements
The biggest benefit of time travel debugging is the ability to find a line of code and add a retroactive print statement. In the example below, we’ll add a
console.log("gPendingMessages", gPendingMessgages, msg) on the line where gPendingMessages.push is called and see what was in the array and msg at the time.Flaky tests can either come from an assumption in your testing logic or application logic. In both cases, it can be helpful to work backwards from the user visible issue to the root cause with console logs that help you narrow down the timing issue. For more info on print statements, check our our docs.
Inspect Console logs
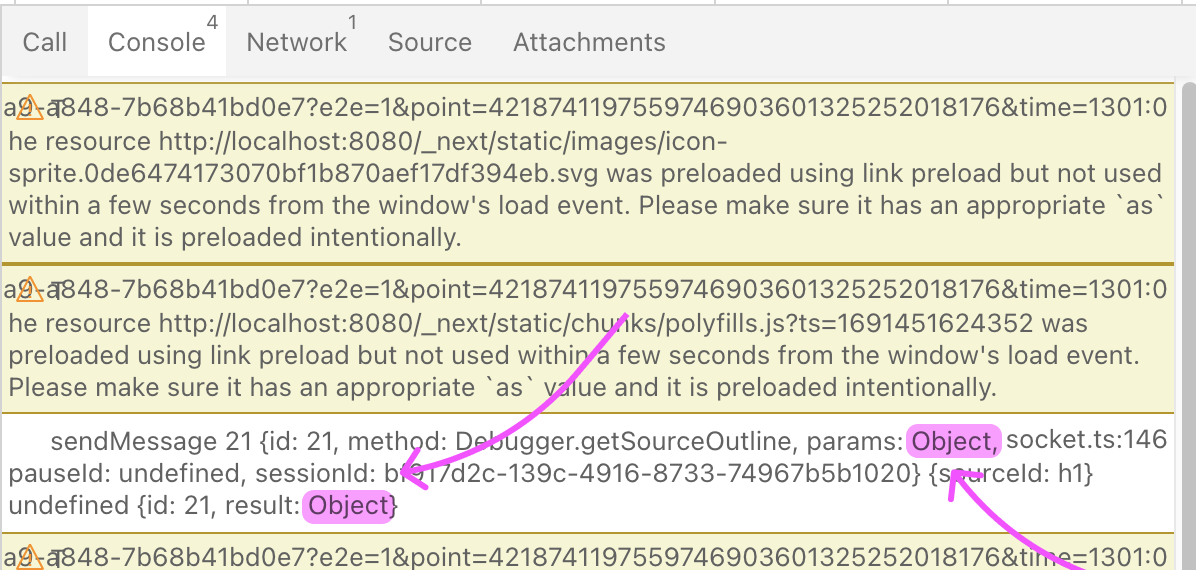
Both Replay DevTools and Trace Viewer let you see the messages that were logged to the Console. but because Playwright has to serialize the logs, most of the interesting values are missing.
For example, in the console logs below the
params and response.result objects are hidden behind an Object label and are not available to be inspected.
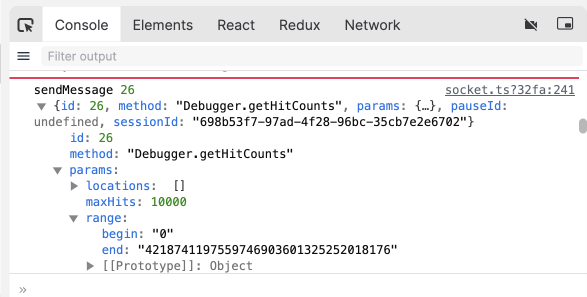
In contrast, the Console logs in Replay DevTools work the same way that they do in Chrome DevTools because they’re logged at replay time instead of record time. This means that you can view any value, expand object and arrays, filter by values above.

And because Replay is a browser, pausing in Replay DevTools is similar to pausing in Chrome DevTools. When you’re paused, you’re able to evaluate expressions in the Console terminal like
response.result.React + Redux DevTools
One of the reasons why it can be difficult to fix a flaky or failing test is that the problem can come from any where. In these cases, it is helpful when you start debugging to open React and Redux DevTools and get a high level map of the relevant React components and Redux actions.
Typically, React DevTools can help you find the React component with the user visible change and narrow the problem down to a render function that receive an unexpected prop or state value. And Redux DevTools can help you work backwards from the bad render to the action that fired which fetched data from the backend or updated the state directly.
In the example, below we’re using React DevTools to inspect Replay’s Console components and view the source code. If we wanted to see what the props were when the components rendered, we could add a
console.log(...) in the code.In the example, below we’re using Redux DevTools to inspect the
pointsReceived and paused actions. Unlike standard Redux DevTools, we’re able to go beyond simply looking at the action payload and application state at that point in time and jump directly into the redux dispatch. From there we can add console logs in the thunk and better understand the sequence of events that lead up to the dispatch.Conclusion
If you are primarily interested in debugging flaky and failing tests in CI, then there is no reason not to record your tests with Replay. Because Replay is a browser, Replay DevTools has everything you’d find in Chrome DevTools and features like retroactive print statements and Jump to Code that are only available in a time travel debugger.
If you are focused on a local development for when you’re writing your tests or run tens of thousands of tests a day and want to collect high level insights about your test suite, then an observability tool like the Trace Viewer makes sense.
If you have any questions about time travel debugging, how Replay DevTools works, or how you can more effectively debug your flaky playwright tests, stop by our Discord or shoot us an email at hey@replay.io.
